Harmonic Patterns Scanner MT5
- インディケータ
- バージョン: 1.11
- アップデート済み: 24 1月 2026
- アクティベーション: 20

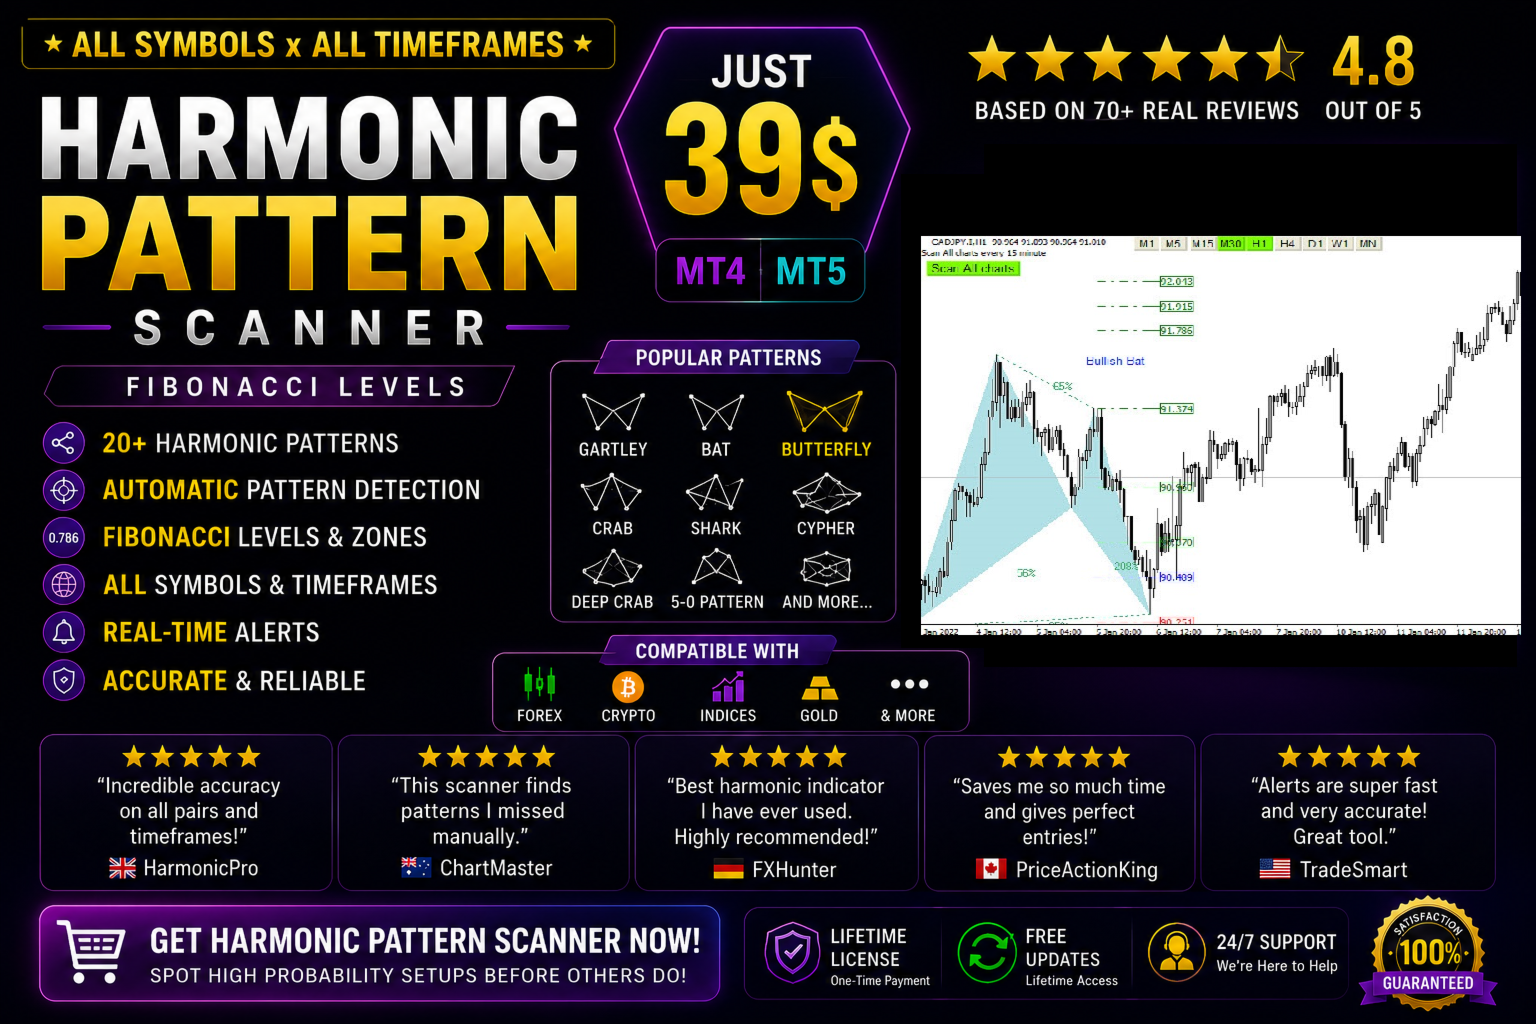
** All Symbols x All Time frames scan just by pressing scanner button **
*** Contact me to send you instruction and add you in "Harmonic Scanner group" for sharing or seeing experiences with other users.
Introduction
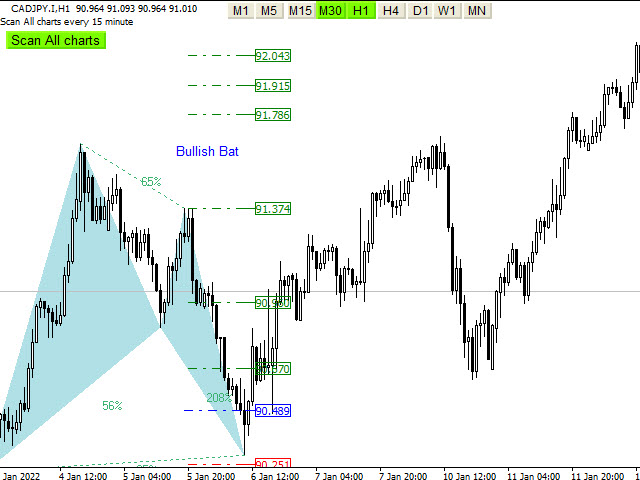
Harmonic Patterns are best used to predict turning point. Harmonic Patterns give you high win rate and high opportunities for trade in during one day. This indicator detects the best and successful patterns based on Harmonic Trading concepts.
The Harmonic Patterns Scanner Scans All charts just by pressing one click. It has stop loss, Take profits and entry point levels with using Fibonacci levels and candlestick checking to find the best entry point and exit of trading. It finds signals immediately with alarm and notification for easy trading.
Main Features
- Detect the best and most successful patterns : Gartley, Bat, Crab, Butterfly, Cypher, Shark, Alt Bat, Deep Crab.
- Easy-to-use and user friendly indicator
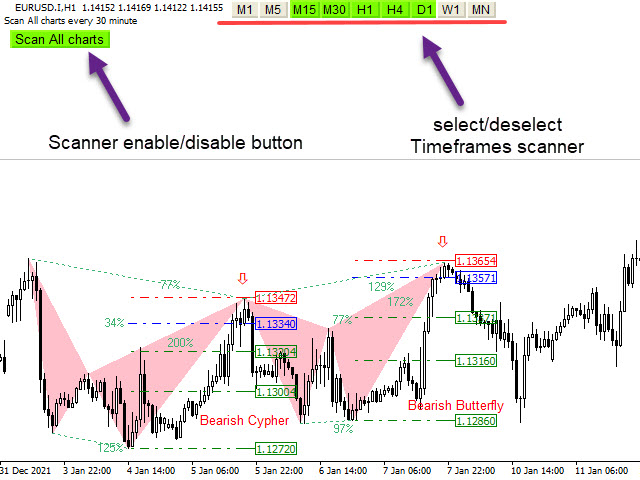
- Scan all charts button ( Forex, Cryptocurrencies, Indices and commodities )
- Select and deselect time frames button for scan (M5,M15,M30,H1,H4,D1,W1,MN)
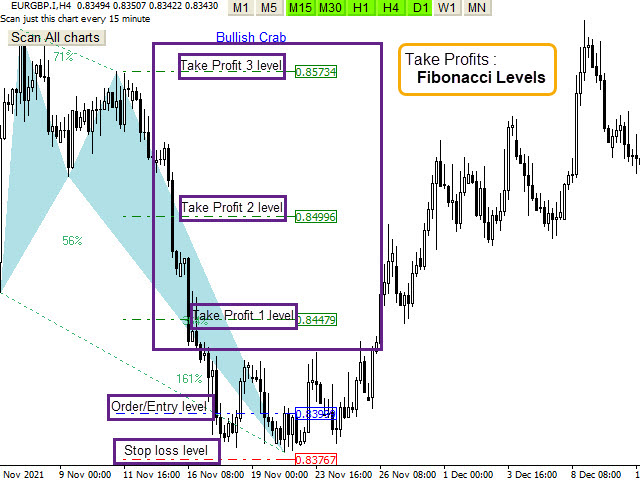
- It displays and pushes notification stop-loss, entry-point and take-profit levels
- Candlestick check for the best entry Point
- Method to choose how appearing pattern : breakout(after breakout) or pattern(in leg 4)
- Use Fibonacci levels
- It draws the ABCD projection
- Potential Reversal Zone(PRZ) detection for Reversal identification
- Potential Continuation Zone(PCZ) detection for price movement prediction
- Pattern Completion Interval(PCI) detection for more trading opportunities
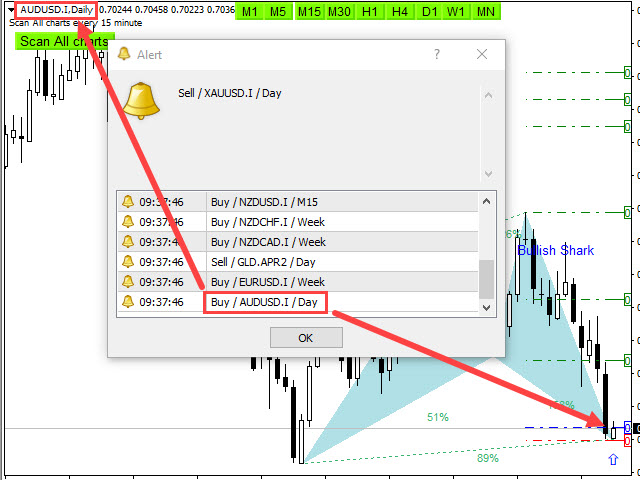
- Sending the alert and push notification
- Alert enable/disable base on your setting time
- Adjust the pattern setting
Input Parameters
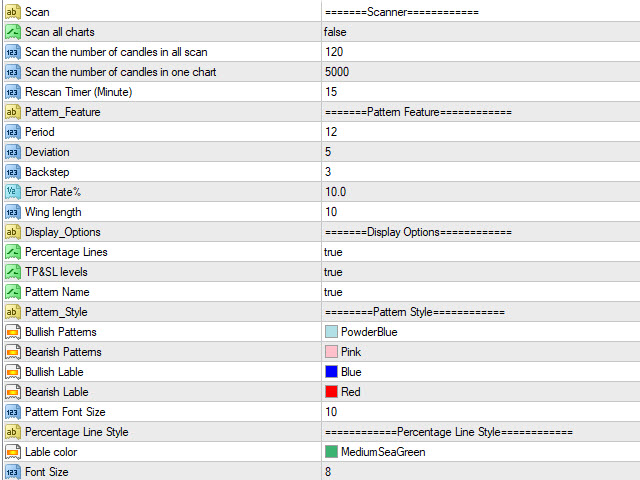
=========Scanner============
- Scan All Charts – Scan in all charts and all time frames
- Scan the number of candles – Amount of history bars to evaluate
- Re scan Timer – Re-scan all chart and all time frames after passing time
- Method - choose how appearing a pattern : breakout(after breakout) or pattern(in leg 4)
=======Pattern Feature============
- Pattern Feature(Period, Deviation, Back step) - Algorithm Parameters for pattern recognition
- Error Rate – Maximum allowable error relative to pattern percentage
- Wing length - Minimum distance between two legs in a pattern
=======Display/style Options============
- Display Options – Display or do not display Percentage Lines, Take Profit and Stop Loss levels or Pattern Name
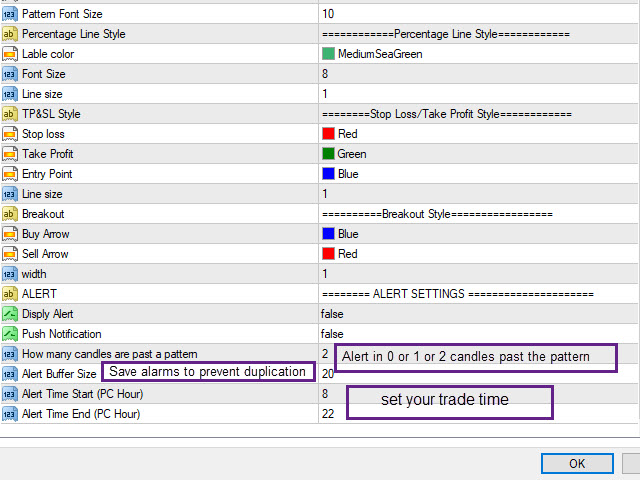
- Pattern, Percentage Line, Stop Loss/Take Profit levels and Breakout Style - Set the Fonts and colors of patterns
========ALERT SETTINGS ==========
- Display Alert or Push Notification – Enable or disable Alert or Push Notification
- How many candles are past a pattern – Maximum Number of candles Passed from a pattern to allow alert
- Alert Buffer Size – Maximum save alert to prevent duplicate alerts
- Alert start/end time – Determine trading hours based on the computer clock to activate and deactivate the alarm


Harmonic scanner is significantly different from other scanners in the market. Currently, I am satisfied with the profit level. I hope to continue to achieve good performance, come on! Quickly answer on any question from the seller,really ,good sevice after selling.