Sting
- Indicadores
- Versión: 1.0
- Activaciones: 5

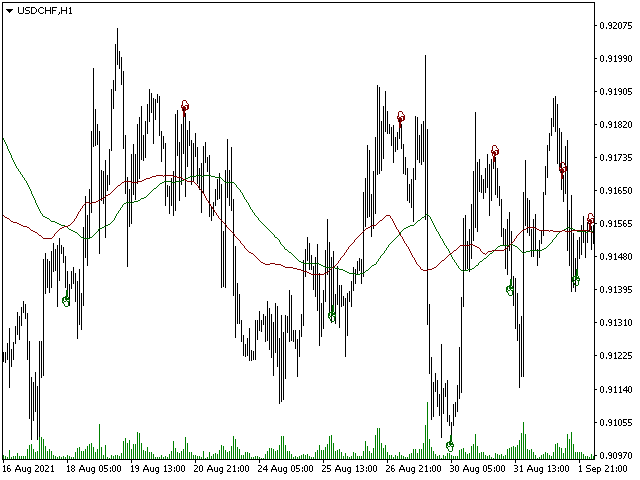
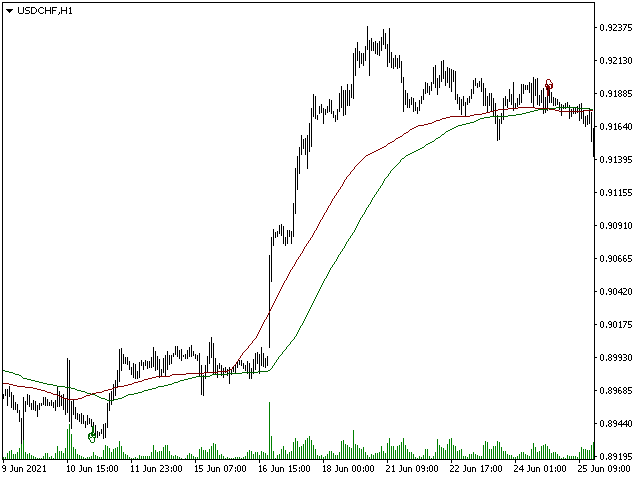
Sting aplica el análisis técnico de indicadores y le permite determinar el estado del mercado en el periodo actual y tomar una decisión sobre una operación basándose en determinadas señales. Sting es el resultado de cálculos matemáticos basados en datos sobre precios y volúmenes de negociación.
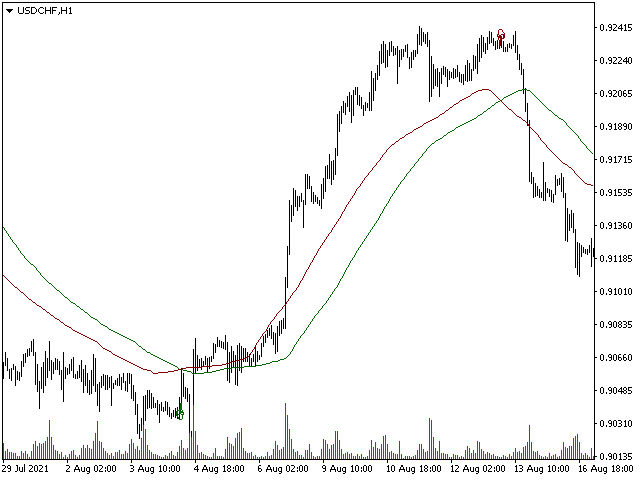
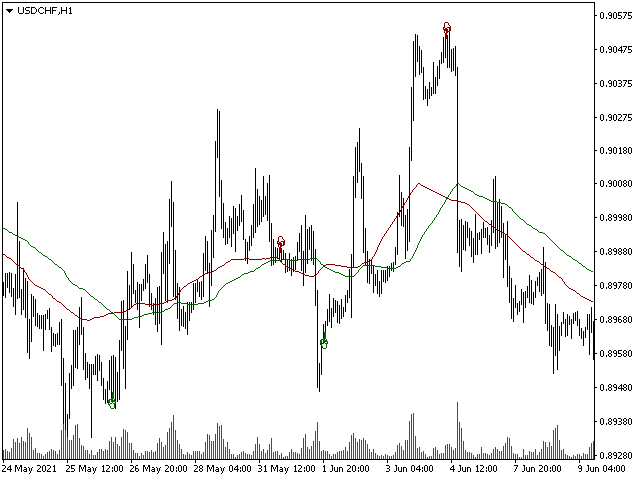
Sting crea señales para realizar operaciones en movimientos de tendencia fuertes; es más conveniente utilizarlo para operar cuando la tendencia se debilita o es lateral. Se utiliza como un adicional, independientemente de la fase del movimiento de tendencia, para confirmar o negar el movimiento actual.
Utilizar Sting es un intento de describir el estado actual de las cosas en el mercado, comprender el equilibrio de poder entre compradores y vendedores y, basándose en esta información, hacer una previsión sobre los cambios de precios.