Yvan Musatov / Vendedor
Productos publicados

Presentamos Trade Vantage : Analista Profesional de Mercados Trade Vantage es una herramienta analítica altamente eficaz que utiliza un algoritmo especializado para operar en los mercados Forex y de criptomonedas. Su principio de funcionamiento se basa en el análisis de los precios durante un intervalo de tiempo determinado, identificando la fuerza y la amplitud de los movimientos de los precios mediante un sistema de indicación único. Cuando una tendencia pierde fuerza y cambia de dirección, e

El indicador de volatilidad SPV es uno de los filtros más eficaces. Filtro de volatilidad. Muestra tres opciones de volatilidad. Las denominadas límite, real, y la última más efectiva para el filtro es el filtro porcentual. El porcentaje de folatilidad muestra la relación entre la volatilidad límite y la volatilidad real. Y así, si operamos en el medio del canal, entonces es necesario establecer la condición de que el porcentaje sea inferior a un determinado valor del indicador. Si operamos en l

Trend Anthropoid es un indicador de tendencia que permite determinar eficazmente la dirección de la tendencia actual, así como identificar posibles puntos de inversión. El indicador permite clasificar la dirección del movimiento del precio determinando su fuerza. Resolver este problema ayuda a entrar en el mercado a tiempo y obtener el resultado deseado.
Empecemos por las ventajas. Permite determinar la tendencia actual. Puede comprender rápidamente qué tendencia se está desarrollando actualme

El indicador Trend Logic permite clasificar la dirección del movimiento del precio determinando su fuerza. Resolver este problema ayuda a entrar en el mercado a tiempo y obtener un buen beneficio. Es extremadamente importante para cualquier operador determinar correctamente la dirección y la fuerza del movimiento de la tendencia. Por desgracia, no existe una única solución correcta para este problema. Muchos operadores operan en diferentes marcos temporales. Por esta razón, las señales recibida

El indicador Trend Goblin identifica la tendencia dominante. Ayudan a analizar el mercado en un marco temporal seleccionado. Es fácil de configurar y funciona en todos los pares y en todos los marcos temporales. Los indicadores de tendencia permiten clasificar la dirección del movimiento de los precios determinando su fuerza. Resolver este problema ayuda a los inversores a entrar en el mercado a tiempo y obtener buenos beneficios.
Es extremadamente importante para cualquier operador determinar

Индикатор Adaptador определяет господствующую тенденцию, помогает анализировать рынок на выбранном временнном интервале. Прост в настройке и работает на всех парах и всех временных интервалах.
Индикаторы тренда дают возможность классифицировать направление ценового движения, определив его силу. Решение этой проблемы помогает инвесторам вовремя войти в рынок и получить хорошую отдачу. Для любого трейдера крайне важно правильно определить направление и силу трендового движения. К сожалению, един

El indicador de tendencia analítica puede seguir el movimiento sostenido de los precios en una dirección concreta. En este caso, el movimiento en sí puede ser a la baja, al alza o lateral, cuando el movimiento del mercado no tiene una dirección pronunciada. El indicador funciona sobre la base de dos medias móviles y un oscilador. Utilizando el algoritmo de búsqueda de señales, el indicador genera señales en forma de flechas. Los ajustes flexibles le permiten recibir señales más precisas para ab

El canal Sobrenatural se determina mediante un algoritmo especial, se utilizan puntos marcadores para determinar el movimiento del canal. El canal Sobrenatural consta de dos líneas, roja y azul, que lo componen. Uso sencillo, visual y eficaz. Puede utilizarse para operaciones dentro del canal. El indicador no se redibuja y no se retrasa. Funciona en todos los pares de divisas y en todos los marcos temporales.

Channel Oscillations es un indicador de canal no redibujado basado en medias móviles. La diferencia clave entre el indicador Channel Oscillations y otros indicadores de canal es que Channel Oscillations no tiene en cuenta las medias móviles simples, sino las de doble suavizado, lo que, por un lado, permite determinar con mayor claridad el movimiento del mercado y, por otro, hace que el indicador sea menos sensible.

Presentamos el indicador de tendencia Diógenes. El indicador analiza la dinámica del mercado en busca de puntos pivote. Muestra momentos favorables para entrar en el mercado en franjas. El principio de funcionamiento del indicador es determinar automáticamente el estado actual del mercado cuando se coloca en un gráfico.
Sistema de trading preparado. Se puede utilizar como indicador de canal o indicador de nivel. Este indicador le permite analizar datos históricos y, basándose en ellos, mostrar

El indicador Trend Champion funciona en todos los plazos y pares de divisas. El indicador debe ser utilizado como una herramienta auxiliar para el análisis técnico, ayuda a determinar la dirección de la tendencia: ya sea alcista o bajista movimiento de los precios para un par de divisas en particular. Puede utilizarse junto con osciladores como filtros.
Trend Champion es un indicador de tendencia. Las flechas indican momentos y direcciones favorables para entrar en el mercado. El indicador pue

El indicador Qubit Trend funciona utilizando la función de dependencia de onda cíclica. Por lo tanto, todos los puntos de entrada serán puntos óptimos en los que cambia el movimiento. Los puntos de entrada deben utilizarse como posibles puntos de inversión del mercado. La configuración predeterminada del indicador es bastante eficaz la mayor parte del tiempo. Puede personalizarlos en función de sus necesidades. Pero no olvide que el enfoque debe ser complejo, las señales del indicador requieren

El canal de regresión es una de las herramientas de análisis técnico más populares entre los operadores. En primer lugar, el indicador traza una línea de tendencia entre dos puntos y, a continuación, sobre su base construye un canal de dos líneas paralelas, que estarán a la misma distancia de la línea de regresión.
El término regresión lineal pertenece al campo de la estadística. La línea central del canal es la línea de tendencia. Para calcularla, se utiliza el método de los mínimos cuadrados

Control Shot - Indicador único para identificar tendencias. El nuevo sistema se adapta al mercado, elimina condiciones adicionales y hace frente a su tarea. Una nueva forma revolucionaria de identificar el inicio de una tendencia antes de tiempo. El indicador de tendencia, muestra señales, se puede utilizar con una óptima relación de riesgo. Utiliza algoritmos fiables en sus cálculos. Muestra momentos favorables para entrar en el mercado con flechas, es decir, utilizar el indicador es bastante

La transición planificada es un indicador de tendencia que ayudará al operador a determinar la dirección de la operación. El indicador tiene un complejo algoritmo de trabajo. Pero para el usuario, sólo quedan dos líneas, la línea roja indica una tendencia de venta, y la línea azul indica una tendencia de compra. Por lo tanto, es bastante sencillo interpretar las señales del indicador. El indicador funciona en diferentes marcos temporales; para trabajar con marcos temporales más bajos, se recomie

Modificar tendencia - Indicador único para identificar tendencias. El indicador tiene un complejo algoritmo de trabajo. Pero para el usuario sólo hay dos colores de flechas, rojo indica una tendencia de venta, azul indica una tendencia de compra. Por lo tanto, es bastante fácil de interpretar las señales del indicador. El indicador funciona en diferentes marcos temporales; para trabajar con marcos temporales más bajos, se recomienda disminuir el período del indicador para entradas más frecuentes

Sólo tiene que descargar el indicador Quarter Strike y abrazar su sueño. Operar dentro del rango de volatilidad siempre ha atraído a los operadores, porque la mayoría de las veces son los instrumentos simples los que resultan ser los más rentables. El indicador Quarter Strike es una variante de la construcción de un canal de precios que da señales de precisión suficientemente alta en cualquier instrumento y período de tiempo. El sesgo u otros parámetros adicionales no se aplican, es decir, el i

El indicador Trinity le dirá si ha configurado correctamente el indicador, mientras que usted puede especificar el intervalo histórico en las barras que le interese. Fíjese en los números que aparecen en el gráfico cerca de las flechas. Son pips de beneficio de una serie de entradas en el indicador. Los pips de ganancia se calculan en el intervalo especificado. La señal puede ser leída sin problemas por cualquier bot. Operar dentro del rango de volatilidad siempre ha atraído a los operadores, p

El indicador SPV refleja claramente el carácter cíclico del mercado. Sólo hay un parámetro clave. Si es igual a uno, entonces se muestra un ciclo rápido, pero si, por ejemplo, el parámetro es 12, entonces el indicador busca un ciclo en las últimas 12 barras. Se pueden ver las subidas y bajadas alternas del indicador y tener tal dependencia del mercado, que se puede utilizar para sacar conclusiones para predecir el comportamiento de los precios. Además, los indicadores se pueden combinar entre sí

El indicador SPV Cross se basa en el indicador SPV . Funciona como dos indicadores juntos en el mismo gráfico. Con diferentes ajustes, puede reaccionar a la intersección de las líneas. Refleja claramente la naturaleza cíclica del mercado. ¡Sólo dos ajustes clave! Funciona según el principio: uno es rápido y el otro lento. Usted puede ver las subidas y bajadas del indicador alterna y tienen una relación con el mercado, que puede ser utilizado para sacar conclusiones para predecir el comportamient

El indicador SPV Corr muestra la correlación porcentual media entre el cuerpo de la barra y sus sombras. Es un sistema muy eficaz para construir diversos filtros y confirmaciones de entrada en el mercado. Fija la ciclicidad y se puede utilizar en el trading de diferentes maneras. Se pueden ver las subidas y bajadas del indicador alternarse y tener tal relación con el mercado, que se puede utilizar para sacar conclusiones para predecir el comportamiento de los precios. Además, los indicadores pue

El indicador SPV Body muestra el análisis medio de la intersección de barras adyacentes. El indicador puede detectar fácilmente movimientos inusuales del mercado que pueden utilizarse como filtro. Para mayor claridad, lleve los gráficos hasta el principio de la historia, cuando las barras estaban incompletas, y el indicador mostrará fácilmente esta anamalia. Un sistema muy eficaz para construir varios filtros y confirmaciones de entrada en el mercado, para excluir las anomalías de la negociación

Mastodon - muestra los posibles puntos de entrada en el mercado.
Según la teoría de las ondas, Mastodon muestra el curso de una onda grande, mientras que el oscilador puede especificar el punto de entrada, es decir, captar el movimiento del precio dentro de ella, es decir, pequeñas "subondas". Si comprende correctamente la naturaleza de las ondas de los movimientos de precios y utiliza el indicador Mastodon junto con un oscilador, podrá crear su propio sistema de negociación, por ejemplo, entr

La ventaja de trabajar con el indicador de señales Gladiator es que el operador no necesita realizar un análisis técnico del gráfico por su cuenta. La herramienta genera señales preparadas en forma de flechas direccionales. El indicador se considera eficaz, ya que no redibuja sus señales. Esta herramienta es una flecha (señal) y funciona sin redibujar. Sus señales se basan en un algoritmo robusto.
Gladiator no cambia sus lecturas. Los rangos diarios y de sesión pueden ser útiles para confirmar

Señal Casablanca - Flecha indicador técnico en el mercado Forex sin redibujar. Capaz de dar pistas con errores mínimos. Combina varios filtros, mostrando los puntos de entrada en el mercado con flechas en el gráfico. Usted puede notar la exactitud y claridad de las señales de este indicador puntero. Tras ver una señal de compra, el operador abre una orden sin esperar que al cabo de un tiempo la pista inicial cambie por otra totalmente opuesta o simplemente desaparezca, habiendo perdido su releva

Fargo no cambia sus lecturas, es un indicador técnico en el mercado Forex sin redibujar. Combina varios filtros para mostrar flechas de entrada al mercado en el gráfico. Puede observar la precisión y claridad de las señales de este indicador puntero. Cuando aparece un momento adecuado para la compra, el indicador genera una señal exactamente en el momento de su aparición y no por debajo o por encima de la vela actual. La flecha estará exactamente en el precio donde aparece la señal y no cambiar

Experto en Tendencias. Funciona entrando en el mercado con una sola orden de compra y otra de venta. ¡No forma una serie de rendimientos, y por lo tanto se puede trabajar con ellos a partir de $ 100! Lo que es genial para los principiantes. Para entrar, utiliza un sistema de indicadores y un sistema de corrección dinámica de las paradas en función de la volatilidad, que puede ser desactivado en la configuración, pero en este caso, se reducirá significativamente la eficiencia del bot. El bot imp

Catch es un indicador de reversión y forma parte de una categoría especial de instrumentos. No sólo analiza el movimiento de los precios, sino que también indica los puntos de posibles reversiones. Esto facilita la apertura rápida y óptima de órdenes de compra o venta (en función de la situación actual). En este caso, hay que tener en cuenta los datos históricos del activo analizado. La correcta ejecución de estas acciones es lo que ayuda en gran medida a los operadores a tomar la decisión corre

El indicador Matios descarga visualmente el gráfico de precios y ahorra tiempo de análisis: si no hay señal, no hay operación; si aparece una señal contraria, hay que cerrar la operación actual. Se trata de un indicador de flecha para determinar la tendencia.
Según la teoría de las ondas, Matios muestra el curso de la onda, mientras que el oscilador puede especificar el punto de entrada, es decir, captar el movimiento del precio dentro de ella, es decir, pequeñas "subondas". Si comprende corre

Sting aplica el análisis técnico de indicadores y le permite determinar el estado del mercado en el periodo actual y tomar una decisión sobre una operación basándose en determinadas señales. Sting es el resultado de cálculos matemáticos basados en datos sobre precios y volúmenes de negociación.
Sting crea señales para realizar operaciones en movimientos de tendencia fuertes; es más conveniente utilizarlo para operar cuando la tendencia se debilita o es lateral. Se utiliza como un adicional, in

Labyrinth - Asesor Experto en Tendencias. Funciona entrando en el mercado en lotes de compra y venta. ¡No forma una serie de representación, y por lo tanto se puede trabajar con ellos a partir de $ 1000! Lo cual es genial para los principiantes. El bot implementa un sistema de gestión de dinero, que consiste en un cálculo competente del riesgo en función del depósito. Para el cálculo correcto del volumen, es necesario especificar el depósito de base para el cálculo del riesgo. Por defecto, esta

Haine es un indicador de inversión que forma parte de una categoría especial de instrumentos. El indicador no sólo analiza el movimiento de los precios, sino que también indica los puntos de posibles retrocesos. Esto facilita la apertura rápida y óptima de órdenes de compra o venta (en función de la situación actual). En este caso, deben tenerse en cuenta los datos históricos del activo analizado. La correcta ejecución de estas acciones es lo que ayuda en gran medida a los operadores a tomar la

El indicador Goodfellas analiza el comportamiento de los precios y si se produce una debilidad temporal en la tendencia, se puede notar en las lecturas del indicador, como en el caso de un cambio de tendencia pronunciado. No es difícil entrar en el mercado, pero es mucho más difícil permanecer en él. Con el indicador Goodfellas será mucho más fácil mantenerse en la tendencia. Este indicador le permite analizar datos históricos y, basándose en ellos, mostrar instrucciones para acciones posterior

Indicador de Forex Indiana le permite analizar los datos históricos, y en base a ellos, mostrar instrucciones para el comerciante para nuevas acciones. Indiana implementa el análisis técnico indicador y le permite determinar el estado del mercado en el período actual y tomar una decisión sobre un acuerdo basado en ciertas señales. Esto es el resultado de cálculos matemáticos basados en datos sobre precios y volúmenes de negociación. Se intenta describir el estado actual de las cosas en el merca

¿Cansado de ajustar la configuración de los indicadores, perdiendo un tiempo precioso? ¿Cansado de la falta de confianza en su optimización? ¿Asustado por lo desconocido en su rentabilidad? Shawshank - Indicador único para identificar tendencias. El nuevo sistema se adapta al mercado, elimina las condiciones adicionales y hace frente a su tarea. Una nueva forma revolucionaria de identificar el inicio de una tendencia antes de tiempo. El indicador Shawshank es para usted. Le ahorrará mucho tiempo

Towers - Indicador de tendencia, muestra señales, se puede utilizar con una relación de riesgo óptima. Utiliza algoritmos fiables en sus cálculos. Muestra momentos favorables para entrar en el mercado con flechas, es decir, utilizar el indicador es bastante sencillo. Combina varios filtros para mostrar flechas de entrada al mercado en el gráfico. Dada esta circunstancia, un especulador puede estudiar el historial de señales del instrumento y evaluar su eficacia. Como puede ver, operar con un ind

El indicador Catchs analiza el comportamiento de los precios y, si se produce una debilidad temporal en la tendencia, se puede ver en las lecturas del indicador, como en el caso de un cambio de tendencia pronunciado. La ventaja de trabajar con el indicador de señales Catchs es que el operador no necesita realizar un análisis técnico del gráfico por su cuenta. La herramienta genera señales preparadas en forma de flechas direccionales. No es difícil entrar en el mercado, pero es mucho más difícil

Unknown Star es un indicador de Forex que realiza cálculos matemáticos, prediciendo los cambios del mercado y facilitando en gran medida el cálculo de los precios en el futuro. La misión de los indicadores de mercado no termina con la predicción de precios. Informa al operador sobre los cambios importantes, incluido el segundo en el que el precio gana o supera el valor. El trabajo de Estrella Desconocida libera al operador de hacer cálculos con su propia mano. El participante del mercado sólo p

El indicador técnico Maravillosa tendencia se utiliza para analizar los movimientos de los precios en el mercado Forex. Es muy práctico, ya que forma flechas en los lugares donde aparecen señales de compra o, por el contrario, señales de venta. El indicador ayuda a analizar el mercado en un intervalo de tiempo seleccionado. Define la tendencia principal. El indicador de tendencia Driver permite clasificar la dirección del movimiento de los precios determinando su fuerza. Resolver este problema

Robot profesional DirectionClassic, que implementa una estrategia para operar con la media móvil y el precio. Cuando la media móvil y el precio se cruzan, se genera una señal de compra o venta. La dirección de la señal se establece en la configuración. El EA maneja los errores correctamente y funciona de forma fiable con un capital a partir de 100 USD. Es importante elegir la dirección de trabajo, ya sea en ambas direcciones, o sólo para la compra o venta. El Asesor Experto utiliza conceptos bá
Un robot profesional que implementa la estrategia de trading clásica basada en el indicador de Bandas. Se genera una señal cuando el precio rebota en los bordes del canal de Bollinger. Cuando el precio rompe o toca la banda superior de Bollinger y luego vuelve, sirve como señal de venta, si el precio rompe o toca la banda inferior de Bollinger, sirve como señal de compra. El Asesor Experto maneja los errores correctamente y funciona de forma fiable en el mercado. ¡Funciona con un capital a part

El indicador Context Aviation analiza el comportamiento de los precios y, si se produce una debilidad temporal en la tendencia, podrá notarlo en las lecturas del indicador, como en el caso de un cambio pronunciado en la dirección de la tendencia. No es difícil entrar en el mercado, pero es mucho más difícil permanecer en él. El indicador Context Aviation hace que sea mucho más fácil mantenerse en la tendencia. Este indicador permite analizar datos históricos y, basándose en ellos, mostrar en la
Un experto profesional analiza el mercado utilizando el índice de fuerza relativa. El principio básico es que el bot toma los precios indicados durante un determinado periodo de tiempo y calcula la fuerza y la amplitud del precio. Esto puede mostrar cuándo la tendencia perderá fuerza y se invertirá. Se analiza la señal de la salida de las zonas de sobrecompra/sobreventa, los niveles de estas zonas serán los niveles con valores LEVEL_MAX y LEVEL_MIN. Compramos cuando la señal cae primero por deb

Un experto profesional analiza el mercado utilizando el índice de fuerza relativa. El principio básico es que el bot toma los precios indicados durante un determinado periodo de tiempo y calcula la fuerza y la amplitud del precio. Esto puede mostrar cuándo la tendencia perderá fuerza y se invertirá. Se analiza la señal de la salida de las zonas de sobrecompra/sobreventa, los niveles de estas zonas serán los niveles con valores LEVEL_MAX y LEVEL_MIN. Compramos cuando la señal cae primero por deb

Waterfront - Un indicador de tendencia único. El nuevo sistema se adapta al mercado, elimina condiciones adicionales y hace frente a su tarea. Una nueva y revolucionaria forma de detectar a tiempo el inicio de una tendencia. Indicador de tendencia, muestra señales, se puede utilizar con una óptima relación de riesgo. Utiliza algoritmos fiables en los cálculos. Muestra momentos favorables para entrar en el mercado con flechas, es decir, utilizar el indicador es bastante sencillo.
Los indicadore

Tendencia polinómica - Herramienta que permite determinar la dirección y la fuerza de una tendencia. A diferencia de la mayoría de los indicadores, Polynomial Trend encuentra tendencias a más largo plazo y da menos señales falsas. Este indicador le permite encontrar los puntos de cambio de tendencia más probables b le permite identificar la fase actual del mercado (tendencia alcista, tendencia bajista).
Este indicador muestra flechas de diferentes colores en función del estado actual del merca

Indicador inteligente Smart trend le permite encontrar los puntos de cambio de tendencia más probables. No encontrará este indicador en ningún otro sitio. Un sistema simple pero eficaz para determinar la tendencia de divisas. Desde las capturas de pantalla se puede ver por sí mismo la exactitud de esta herramienta. Funciona en todos los pares de divisas, acciones, materias primas, cryptocurrencies. Este es un indicador de tendencia para la plataforma de comercio MetaTrader 4.
El sistema de ale

Robi Auto Expert Advisor funciona utilizando movimientos de ticks agudos. Recorre todo el historial y todos los pares de divisas con un solo ajuste. Cuanta más latencia tenga su broker en la cantidad del canal de Internet, más alto tendrá que fijar el stop loss, take profit y trailing stop para que el servidor pueda procesarlos al precio deseado y menor será la frecuencia de negociación. La singularidad del Asesor Experto es que se puede ejecutar en cualquier período horario, en cualquier par d
Si aún no tiene su propia estrategia de negociación, puede utilizar nuestra estrategia de negociación ya preparada en forma de este indicador. El indicador Your Trends sigue la tendencia del mercado, ignorando las fluctuaciones bruscas del mercado y el ruido en torno al precio medio.
El indicador se basa en la divergencia de precios. Además, sólo las medias móviles y un algoritmo especial se utilizan para el trabajo. Ayudará a encontrar puntos de entrada en el análisis y muestra con flechas lo

¿Cansado de elegir la configuración de los indicadores, perdiendo un tiempo precioso? ¿Cansado de la incertidumbre en su optimalidad? ¿Asustado por lo desconocido en su rentabilidad? Entonces el indicador Trend IM es justo para usted. El indicador le ahorrará mucho tiempo que puede dedicar a actividades más útiles, como relajarse, pero al mismo tiempo, la eficiencia aumentará muchas veces. Utiliza sólo un parámetro para el ajuste, que establece el número de barras para el cálculo.
Trend IM es

Para entender el trabajo de un bot, en primer lugar, hay que entender qué parámetros tiene. Por lo tanto, creo que una descripción detallada de los parámetros será la mejor descripción del bot. Ya que dará al usuario una comprensión de lo que está tratando y le permitirá decidir, este bot es adecuado para su estilo de negociación y permitirá a su corredor para trabajar con la ayuda de este bot. Asegúrese de establecer Fake Robot On = false Parámetros básicos, una serie de parámetros clave que l

El indicador Tendencia Estructural ayuda a analizar el mercado en el intervalo de tiempo seleccionado. Define la tendencia principal. Es fácil de configurar y funciona en todos los pares y en todos los marcos temporales. Los indicadores de tendencia permiten clasificar la dirección del movimiento de los precios determinando su fuerza.
Structural Trend es una solución de negociación y filtrado de tendencias con todas las características importantes de una herramienta de tendencias integradas en

ForceX Trend es un indicador de tendencia que permite determinar eficazmente la dirección de la tendencia actual, así como identificar posibles puntos de reversión. El indicador permite clasificar la dirección del movimiento del precio determinando su fuerza. Resolver este problema ayuda a entrar en el mercado a tiempo y obtener el resultado deseado.
Empecemos por las ventajas.
Permite determinar la tendencia actual. Puede comprender rápidamente qué tipo de tendencia se está desarrollando act

El indicador Cyber Trend analiza la acción del precio y si hay una debilidad temporal en la tendencia, se puede notar en las lecturas del indicador, como en el caso de un cambio pronunciado en la dirección de la tendencia. Entrar en el mercado no es difícil, pero mantenerse es mucho más difícil. Seguir la tendencia será mucho más fácil con el indicador Cyber Trend. Este indicador le permite analizar datos históricos y, basándose en ellos, mostrar instrucciones al operador para futuras acciones.

El indicador Trends Trg determina la tendencia predominante. Ayudan a analizar el mercado en el intervalo de tiempo seleccionado. Es fácil de configurar y funciona en todos los pares y en todos los marcos temporales. Los indicadores de tendencia permiten clasificar la dirección del movimiento de los precios determinando su fuerza. Resolver este problema ayuda a los inversores a entrar en el mercado a tiempo y obtener una buena rentabilidad.
Es extremadamente importante para cualquier operador

El experto profesional Effect Trader analiza el mercado utilizando un algoritmo especial. El principio básico es que el bot toma los precios indicados durante un cierto periodo de tiempo y calcula la fuerza y amplitud del precio comprobándolo con su propio sistema de indicación basado en datos reales. Se fija el momento en que la tendencia pierde fuerza y se invierte, y entonces se cierra la serie anterior y se prepara una nueva. El bot también analiza sus propias señales de sobrecompra/sobreve

El experto profesional Status Trader analiza el mercado utilizando un algoritmo especial. El principio básico es que el bot toma los precios indicados durante un cierto periodo de tiempo y calcula la fuerza y amplitud del precio comprobándolo con su propio sistema de indicación basado en datos reales. Se fija el momento en que la tendencia pierde fuerza y se invierte, y entonces se cierra la serie anterior y se prepara una nueva. El bot también analiza sus propias señales de sobrecompra/sobreve

El indicador Trahin determina la tendencia predominante. Ayudan a analizar el mercado en un intervalo de tiempo seleccionado. Es fácil de configurar y funciona en todos los pares y en todos los intervalos de tiempo. Los indicadores de tendencia permiten clasificar la dirección del movimiento de los precios, determinando su fuerza. Resolver este problema ayuda a los inversores a entrar en el mercado a tiempo y obtener buenos beneficios.
Para cualquier operador, es extremadamente importante dete

El indicador Crit analiza el comportamiento de los precios y, si hay una debilidad temporal en la tendencia, se puede notar en las lecturas del indicador, como en el caso de un cambio pronunciado en la dirección de la tendencia. Entrar en el mercado no es difícil, pero mantenerse en él lo es mucho más. Con el indicador Crit, mantenerse en la tendencia será mucho más fácil. Este indicador le permite analizar datos históricos y, basándose en ellos, mostrar instrucciones para acciones posteriores

El robot de trading Top Algo es un desarrollo técnico para la automatización del trading en el mercado de divisas Forex. Su objetivo es ayudar tanto a los participantes novatos del mercado que no tienen una base fundamental en el campo del trading como a los profesionales y facilitar el proceso de aumento de beneficios para los inversores experimentados. Top Algo también puede ser llamado un robot-asesor multidivisa, ya que puede trabajar en varios pares de divisas.
Un experto profesional de T

El indicador Practitioner se basa en un algoritmo único para analizar el comportamiento de los precios y presenta el resultado de este complejo trabajo en forma de líneas. Una de las ventajas de este indicador es que cambia automáticamente el color de la línea según la dirección actual del movimiento del precio.
Es importante señalar que el indicador tiene una opción para activar alertas cuando cambia el color de la línea. Esto da al operador la oportunidad de responder rápidamente a los cambi

Indicador TrendTrack : ¡Siga la tendencia fácilmente!
El indicador TrendTrack está diseñado para analizar el comportamiento de los precios en el mercado Forex, ayudando al operador a detectar rápidamente debilidades temporales o cambios evidentes en la dirección de la tendencia. Entrar en el mercado es sólo el primer paso, pero mantener una posición es más difícil. Con TrendTrack, ¡mantener la tendencia se convierte en algo fácil!
Peculiaridades :
Análisis de tendencias : El indicador analiz

El indicador Dreadnought analiza cuidadosamente la dinámica de los precios, identificando el debilitamiento temporal de la tendencia y los cambios bruscos en su dirección. Controlando este indicador, podrá advertir fácilmente los cambios en el mercado y tomar las medidas oportunas. Entrar en el mercado puede ser fácil, pero mantener una posición es mucho más difícil. Con Dreadnought, dispondrá de un apoyo fiable para adelantarse con éxito a la tendencia. Este indicador analiza los datos históri

Un Experto Richter es un analista de mercado profesional que trabaja utilizando un algoritmo especializado. Analizando los precios durante un periodo de tiempo específico, determina la fuerza y la amplitud de los precios utilizando un sistema de indicadores único basado en datos reales. Cuando la tendencia y su dirección cambian, el experto cierra la posición actual y abre una nueva. Los algoritmos del bot tienen en cuenta las señales de sobrecompra y sobreventa de los mercados. La compra se pr

El experto profesional Status Auto analiza el mercado utilizando un algoritmo especial. El principio básico es que el bot toma los precios indicados durante un cierto periodo de tiempo y calcula la fuerza y amplitud del precio comprobándolo con su propio sistema de indicación basado en datos reales. Se fija el momento en que la tendencia pierde fuerza y se invierte, y entonces se cierra la serie anterior y se prepara una nueva. El bot también analiza sus propias señales de sobrecompra/sobrevent

Innovador robot de trading Smart Capital: Su socio de confianza en el mercado Forex
Smart Capital es un avanzado robot de trading creado para analizar en profundidad los mercados financieros mediante algoritmos especializados. Este robot está diseñado para evaluar datos complejos del mercado, lo que le permite predecir con precisión los cambios de tendencia y tomar decisiones de trading óptimas. Con su ayuda, puede aumentar significativamente la eficiencia de sus inversiones.
Ventajas de Smar

Logistician - Asesor Experto Algorítmico Basado en Lógica Estadística Logistician es un Asesor Experto de trading profesional que aplica un modelo logístico propio para analizar el comportamiento del mercado. Funciona mediante un algoritmo con base matemática que evalúa la fuerza y la amplitud de los precios durante un periodo determinado y toma decisiones de negociación basadas en indicadores estadísticos internos, sin utilizar herramientas técnicas externas. El sistema está diseñado para dete

Innovador robot de trading Smart Capital: Su socio de confianza en el mercado Forex
Smart Capital es un avanzado robot de trading creado para analizar en profundidad los mercados financieros mediante algoritmos especializados. Este robot está diseñado para evaluar datos complejos del mercado, lo que le permite predecir con precisión los cambios de tendencia y tomar decisiones de trading óptimas. Con su ayuda, puede aumentar significativamente la eficiencia de sus inversiones.
Ventajas de Smar

El Asesor Experto Sequoia es un analista de mercado profesional que trabaja utilizando un algoritmo especializado. Basándose en el análisis de los precios durante un intervalo de tiempo específico, revela la fuerza y la amplitud de los precios utilizando un sistema de indicación único basado en datos reales. MT5 https://www.mql5.com/en/market/product/118897
Cuando la fuerza de la tendencia y su dirección cambian, el experto cierra la posición actual y abre una nueva. Los algoritmos del bot inc

El experto profesional Bird Onix analiza el mercado utilizando un algoritmo especial. El principio básico es que el bot toma los precios especificados para un determinado periodo de tiempo y calcula la fuerza y amplitud del precio comparándolo con su propio sistema de indicación basado en datos reales. Se registra el momento en que la tendencia pierde fuerza y se invierte, y entonces se cierra la serie anterior y se prepara una nueva. El bot también analiza sus propias señales de sobrecompra/so

El indicador Cosa Interesante descarga visualmente el gráfico de precios y ahorra tiempo de análisis: si no hay señal, no hay trato, si aparece una señal contraria, hay que cerrar el trato actual. Se trata de un indicador de flecha para determinar la tendencia.
El indicador implementa una estrategia de negociación de tendencia, filtrado y todas las funciones necesarias integradas en una sola herramienta. El principio de funcionamiento del indicador es determinar automáticamente el estado actua

Robot profesional DirectionClassic, que implementa una estrategia para operar con la media móvil y el precio. Cuando la media móvil y el precio se cruzan, se genera una señal de compra o venta. La dirección de la señal se establece en la configuración. El EA maneja los errores correctamente y funciona de forma fiable con un capital a partir de 100 USD. Es importante elegir la dirección de trabajo, ya sea en ambas direcciones, o sólo para la compra o venta. El Asesor Experto utiliza conceptos bá
Un robot profesional que implementa la estrategia de trading clásica basada en el indicador de Bandas. Se genera una señal cuando el precio rebota en los bordes del canal de Bollinger. Cuando el precio rompe o toca la banda superior de Bollinger y luego vuelve, sirve como señal de venta, si el precio rompe o toca la banda inferior de Bollinger, sirve como señal de compra. El Asesor Experto maneja los errores correctamente y funciona de forma fiable en el mercado. ¡Funciona con un capital a part
Tendencia Calculada - el indicador de tendencia crea puntos de dos colores a lo largo del gráfico, conectados por líneas. Este es un indicador de tendencia, es un indicador algorítmico. Fácil de usar y entender cuando aparece un círculo azul, usted necesita comprar, cuando aparece un círculo rojo, usted necesita vender. El indicador indica bien los puntos de inicio de una tendencia y su finalización o inversión. Trabajar en el mercado de divisas Forex sin indicadores de tendencia es casi imposib
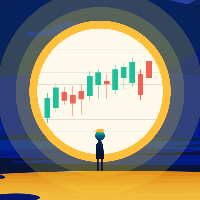
Un experto profesional analiza el mercado utilizando el índice de fuerza relativa. El principio básico es que el bot toma los precios indicados durante un determinado periodo de tiempo y calcula la fuerza y la amplitud del precio. Esto puede mostrar cuándo la tendencia perderá fuerza y se invertirá. Se analiza la señal de la salida de las zonas de sobrecompra/sobreventa, los niveles de estas zonas serán los niveles con valores LEVEL_MAX y LEVEL_MIN. Compramos cuando la señal cae primero por deb

Un experto profesional analiza el mercado utilizando el índice de fuerza relativa. El principio básico es que el bot toma los precios indicados durante un determinado periodo de tiempo y calcula la fuerza y la amplitud del precio. Esto puede mostrar cuándo la tendencia perderá fuerza y se invertirá. Se analiza la señal de la salida de las zonas de sobrecompra/sobreventa, los niveles de estas zonas serán los niveles con valores LEVEL_MAX y LEVEL_MIN. Compramos cuando la señal cae primero por deb

Flecha indicador técnico sin redibujar Vendetta en el mercado Forex es capaz de dar consejos con el menor número de errores. El indicador no redibuja sus señales cuando el precio cambia. Combina varios filtros, mostrando flechas de entrada al mercado en el gráfico.
Cada subida y bajada se refleja en su estado emocional: la esperanza es sustituida por el miedo, y cuando éste pasa, la esperanza aparece de nuevo. El mercado utiliza tu miedo para evitar que aproveches una posición fuerte. En esos
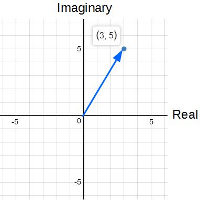
ComplexVector es un indicador basado en el análisis del mercado utilizando el aparato matemático de los números complejos. La esencia del indicador es que, con impulsos claros, indica los momentos en los que es necesario tomar decisiones. Los impulsos son como un cardiograma que muestra los latidos del mercado.
Por ejemplo puede ser el momento de planificar una nueva entrada. puede ser el momento de salir de la posición. si se trabaja con una serie que está en drawdown, se recomienda cerrarla
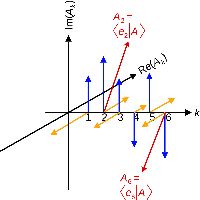
ComplexVectorHL es un indicador que caracteriza el cambio en las tendencias del mercado a corto plazo. El indicador se basa en el análisis del mercado utilizando el aparato matemático de los números complejos. La esencia del indicador es que, con impulsos claros, indica los momentos en los que es necesario tomar decisiones. Los impulsos son como un cardiograma que muestra los latidos del mercado. El indicador tiene impulsos sólo en una dirección (a diferencia del desarrollo anterior de ComplexV

Orion MA basado en indicadores de dos Medias Móviles y Vector Complejo HL, el sistema no permite mantener una operación o una serie de operaciones durante demasiado tiempo, mientras que al mismo tiempo sigue siendo un sistema fiable precisamente porque los indicadores básicos son simples y sin redibujar.
En el caso de dos Medias Móviles, una señal de compra se produce cuando una línea con un período más corto cruza la larga desde abajo. Si viola la frontera por arriba, llega el momento de la v
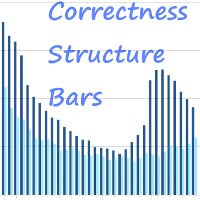
El indicador Correctness Structure Bars muestra la estructura de barras en términos digitales. Cómo interpretar la información proporcionada por el indicador Es muy sencillo, todo lo que tiene que hacer es analizar el gráfico. Vamos a explicar el trabajo utilizando un ejemplo, tome el instrumento EURUSD en el marco de tiempo D1, instale este indicador y analice la información proporcionada por el indicador. El indicador trabaja en la parte inferior del gráfico y da el resultado en forma de hist
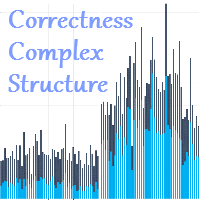
El indicador Corrección Estructura Comple ja muestra la estructura compleja de la barra, teniendo en cuenta los volúmenes de ticks en términos digitales. Cómo interpretar la información proporcionada por el indicador. Es muy sencillo, basta con analizar el gráfico. Vamos a explicar el trabajo utilizando un ejemplo, tome el instrumento EURUSD en el marco de tiempo D1, instale este indicador y analice la información proporcionada por el indicador. El indicador trabaja en la parte inferior del grá

KrakNix es un Asesor Experto de tendencia para un trading tranquilo. El Asesor Experto está diseñado para el comercio a largo plazo, no trae grandes beneficios en el corto plazo, pero puede trabajar de forma estable en el mercado durante mucho tiempo, a lo largo de la historia. Cuanto mayor sea el marco temporal, más estable será el trabajo del Asesor Experto. Las pruebas se muestran en el marco de tiempo M5 para mayor claridad, pero para el trabajo real se recomienda trabajar en los marcos de

Un indicador técnico de flecha sin redibujar Signal Breakthrough en el mercado Forex es capaz de dar consejos con el menor número de errores.
Cada subida y cada bajada se reflejan en su estado emocional: la esperanza es sustituida por el miedo, y cuando éste pasa, vuelve a aparecer la esperanza. El mercado utiliza tu miedo para evitar que aproveches una posición fuerte. En esos momentos eres más vulnerable. Los pares de divisas nunca suben ni bajan en línea recta. Sus subidas y bajadas se inte

Basta con optimizar Regular una vez, por ejemplo, al mes. Después de eso, Hanvest muestra excelentes resultados en el período hacia adelante. Hay varios parámetros que optimizar. Además del propio indicador, es necesario optimizar los niveles de parada. Es necesario operar en el marco temporal M1. El Asesor Experto fue creado para el comercio en EURUSD, pero también puede funcionar en otros pares de divisas, es necesario seleccionarlo. El Asesor Experto determina automáticamente el número de dí

El indicador Trend A es un indicador de flecha prospectivo que sigue de forma fiable la tendencia del mercado, ignorando las fluctuaciones bruscas del mercado y el ruido en torno al precio medio. Capta la tendencia y muestra con flechas los momentos favorables para entrar en el mercado. El indicador se puede utilizar tanto para pips en periodos cortos como para operaciones a largo plazo. El indicador implementa un tipo de análisis técnico basado en la idea de que el mercado es cíclico por natura

El scalping (scalping, pipsing) es un enfoque de negociación basado en el análisis técnico y consiste en abrir y cerrar un gran número de operaciones en cortos periodos de tiempo: las operaciones se mantienen abiertas desde unos pocos milisegundos hasta varios minutos. En otras palabras, el objetivo del scalping en Forex no es mantener una posición durante horas, días o semanas, sino obtener beneficios en cuestión de minutos o incluso segundos, sólo unos pocos puntos por operación.
En la práct

El robot de comercio Forex Hypsilophodons es un programa informático basado en un conjunto de señales para el comercio de la divisa EURUSD. Se trata de un software de trading automático que coloca órdenes en el mercado de acuerdo con el código de programación proporcionado. Hypsilophodons es un robot de comercio automatizado disponible 24/7.
El Asesor Experto Hypsilophodons pertenece a los robots Forex de tendencia que operan cuando las señales coinciden. La base del trabajo del robot es el co

El indicador Sinas para Forex puede utilizarse tanto para obtener pips en periodos cortos como para operar a largo plazo. Sigue la tendencia del mercado, ignorando las fluctuaciones bruscas del mercado y el ruido alrededor del precio medio. Capta la tendencia y muestra con flechas los momentos favorables para entrar en el mercado. El indicador implementa un tipo de análisis técnico basado en la idea de que el mercado es cíclico por naturaleza.

El indicador Hrum se creó para neutralizar las pausas temporales y los retrocesos. Analiza el comportamiento de los precios y, si hay una debilidad temporal en la tendencia, se puede notar en las lecturas del indicador, como en el caso de un cambio pronunciado en la dirección de la tendencia. Entrar en el mercado no es difícil, pero mantenerse es mucho más difícil. Con el indicador Giordano Bruno y su línea de tendencia única, ¡mantenerse en la tendencia será mucho más fácil!
Cada subida y cad

Торговый робот Top Algo является технической разработкой для автоматизации торговли на валютном Форекс рынке. Его цель - помочь как начинающим участникам рынка, у которых недостаточно фундаментальной базы в сфере трейдинга. так и профессиональным и облегчить опытным инвесторам процесс приумножения прибыли. Top Algo можно также назвать мультивалютным роботом-советником, так как он может работать на нескольких валютных парах.
Профессиональный эксперт Top Algo может подключиться к вашему торговом

El indicador del canal de Chapon es un indicador de canal clásico que permite al operador reaccionar cuando el precio sobrepasa los límites del canal establecido. Este canal se forma a partir del análisis de varias velas, empezando por la última, para determinar los extremos en el periodo considerado. A partir de estos extremos se construyen las líneas del canal.
La negociación de canales es una de las estrategias más populares en el mercado Forex y, debido a su simplicidad, incluso los princi

El indicador Volatility de Vanguard se basa en el análisis de la volatilidad de los precios a largo y corto plazo. Ayuda a determinar los puntos de entrada en el mercado mostrando con flechas los puntos de entrada favorables. Este indicador puede utilizarse como filtro en la negociación o como herramienta para mostrar la dirección exacta de la tendencia. Es adecuado tanto para el scalping en pequeños intervalos de tiempo como para el trading a largo plazo. Es importante recordar que el éxito de

El Asesor Experto Sequoia es un analista de mercado profesional que trabaja utilizando un algoritmo especializado. Basándose en el análisis de los precios durante un intervalo de tiempo específico, revela la fuerza y la amplitud de los precios utilizando un sistema de indicación único basado en datos reales. Cuando la fuerza de la tendencia y su dirección cambian, el experto cierra la posición actual y abre una nueva. Los algoritmos del bot incluyen señales sobre mercados sobrecomprados y sobre

El indicador Supernova Momentums simplifica la percepción visual del gráfico de precios y reduce el tiempo de análisis: si no hay señal, no se abre la operación, y si aparece una señal contraria, se recomienda cerrar la posición actual. Este indicador de flecha está diseñado para determinar la tendencia.
Supernova Momentums aplica una estrategia de negociación tendencial, filtra el ruido del mercado e incluye todas las funciones necesarias en una sola herramienta. Su trabajo se basa en determi

Un Experto Richter es un analista de mercado profesional que trabaja utilizando un algoritmo especializado. Analizando los precios durante un periodo de tiempo específico, determina la fuerza y la amplitud de los precios utilizando un sistema de indicadores único basado en datos reales. Cuando la tendencia y su dirección cambian, el experto cierra la posición actual y abre una nueva. Los algoritmos del bot tienen en cuenta las señales de sobrecompra y sobreventa de los mercados. La compra se pr

Presentamos Trade Vantage : Analista Profesional de Mercados Trade Vantage es una herramienta analítica altamente eficaz que utiliza un algoritmo especializado para operar en los mercados Forex y de criptomonedas. Su principio de funcionamiento se basa en el análisis de los precios durante un intervalo de tiempo determinado, identificando la fuerza y la amplitud de los movimientos de los precios mediante un sistema de indicación único. Cuando una tendencia pierde fuerza y cambia de dirección, e

Logistician - Asesor Experto Algorítmico Basado en Lógica Estadística Logistician es un Asesor Experto de trading profesional que aplica un modelo logístico propio para analizar el comportamiento del mercado. Funciona mediante un algoritmo con base matemática que evalúa la fuerza y la amplitud de los precios durante un periodo determinado y toma decisiones de negociación basadas en indicadores estadísticos internos, sin utilizar herramientas técnicas externas. El sistema está diseñado para dete

Innovador robot de trading Smart Capital: Su socio de confianza en el mercado Forex
Smart Capital es un avanzado robot de trading creado para analizar en profundidad los mercados financieros mediante algoritmos especializados. Este robot está diseñado para evaluar datos complejos del mercado, lo que le permite predecir con precisión los cambios de tendencia y tomar decisiones de trading óptimas. Con su ayuda, puede aumentar significativamente la eficiencia de sus inversiones.
Ventajas de Smar

El experto profesional Bird Onix analiza el mercado utilizando un algoritmo especial. El principio básico es que el bot toma los precios especificados para un determinado periodo de tiempo y calcula la fuerza y amplitud del precio comparándolo con su propio sistema de indicación basado en datos reales. Se registra el momento en que la tendencia pierde fuerza y se invierte, y entonces se cierra la serie anterior y se prepara una nueva. El bot también analiza sus propias señales de sobrecompra/so

El experto profesional Status Auto analiza el mercado utilizando un algoritmo especial. El principio básico es que el bot toma los precios indicados durante un cierto periodo de tiempo y calcula la fuerza y amplitud del precio comprobándolo con su propio sistema de indicación basado en datos reales. Se fija el momento en que la tendencia pierde fuerza y se invierte, y entonces se cierra la serie anterior y se prepara una nueva. El bot también analiza sus propias señales de sobrecompra/sobrevent

El experto profesional Effect Trader analiza el mercado utilizando un algoritmo especial. El principio básico es que el bot toma los precios indicados durante un cierto periodo de tiempo y calcula la fuerza y amplitud del precio comprobándolo con su propio sistema de indicación basado en datos reales. Se fija el momento en que la tendencia pierde fuerza y se invierte, y entonces se cierra la serie anterior y se prepara una nueva. El bot también analiza sus propias señales de sobrecompra/sobreve

El experto profesional Status Trader analiza el mercado utilizando un algoritmo especial. El principio básico es que el bot toma los precios indicados durante un cierto periodo de tiempo y calcula la fuerza y amplitud del precio comprobándolo con su propio sistema de indicación basado en datos reales. Se fija el momento en que la tendencia pierde fuerza y se invierte, y entonces se cierra la serie anterior y se prepara una nueva. El bot también analiza sus propias señales de sobrecompra/sobreve