Crazy Cloud MT4
- Indicadores
- Versión: 1.6
- Actualizado: 1 junio 2021
- Activaciones: 5

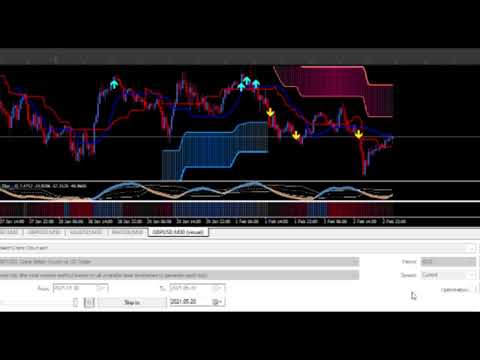
Hice este indicador para ayudarle a establecer stoploss eficaz y obtener más señales de seguir las tendencias. Este indicador ayuda a decir las tendencias y sideway, cuando 2 líneas están sobre de nube azul, significa uptrend. Cuando 2 líneas están por encima de la nube roja, significa tendencia a la baja, el otro, significa mercado lateral. Para tomar la orden, usted tiene que esperar las flechas. También necesita ver la posición de la nube, si la nube es res, tiene que esperar la flecha amarilla para la orden de venta. Si la nube es azul, tiene que esperar la flecha azul para la orden de compra.
Para la versión gratuita: Puede operar en GBPUSD y GBPJPY en M30 Time Frame
https://www.mql5.com/en/market/product/67266?source=Site+Market+MT4+Search+Rating004%3acrazy+cloud