Aggression Monitor FX
- Indicadores
-
Flavio Javier Jarabeck
 We are a closed brotherhood of traders whose ultimate goal is to profit through well-studied, structured, and automated trades. As a result, we publish dozens of MT5 indicators (FREE and paid) to the global MQL5 community. 80% of our published products are high-quality free indicators so beginner
 - Versión: 1.1
- Actualizado: 23 mayo 2025
- Activaciones: 20
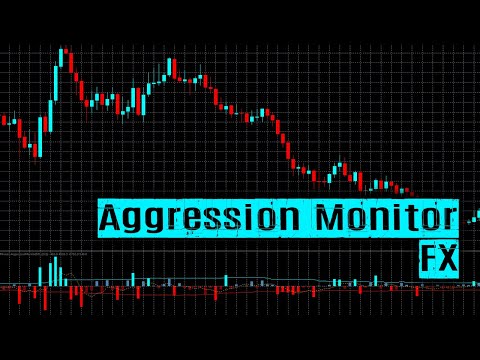
¿Le gustaría seguir minuto a minuto las agresiones entre Compradores y Vendedores? Ahora puede hacerlo. ¡Bienvenido al Monitor de Agresión FX!
El indicador Aggression Monitor F X fue desarrollado para aquellos mercados que no proporcionan datos REALES de Volumen, es decir, como el mercado Forex.
Desarrollamos una forma de utilizar datos de Volumen Tick de 1 minuto generados por los Brokers de Forex (y otros) y manipularlos en información de "agresión" en un histograma muy visual con líneas de análisis adicionales. ¡Y funcionó! (pero ¡hey! no tienes que creernos, puedes probar nuestra versión de demostración totalmente gratuita por ti mismo en tus gráficos - instrucciones más abajo).
Y además, NO es sólo para Forex, ya que este indicador también tiene la opción de cambiarlo a Volumen Real, ¡donde esté disponible!
¿Pero el Tick Volume es tan bueno como el Volumen Real?
Según Caspar Marney - un veterano Trader de Forex, puede consultar su perfil en Linkedin - llevó a cabo un estudio publicado en la revista FX Trader Magazine, abril-junio 2011, con el título de"¿Son las actualizaciones de precios un buen proxy para el volumen real negociado en FX?", ¡y encontró que la correlación entre los dos está en el rango del 90% o más!
CÓMO "LEER" ESTE INDICADOR
- Utilizando el Análisis Técnico clásico que ya conoce, puede confirmar varios patrones y confluencias con el Monitor de Agresión FX.
- Los fans de Wyckoff disfrutarán de esta información adicional sobre el Volumen.
- Los Scalpers pueden utilizar este indicador para encontrar puntos de agotamiento y continuación (M5 timeframes y superiores).
- Se trata de un indicador no rezagado (bueno, lo es un poco, ya que su frecuencia es de 1 minuto) que puede utilizar para respaldar y confirmar todas sus decisiones estratégicas.
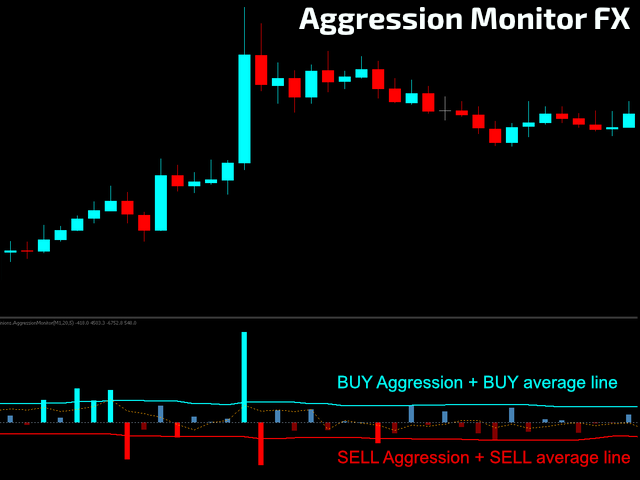
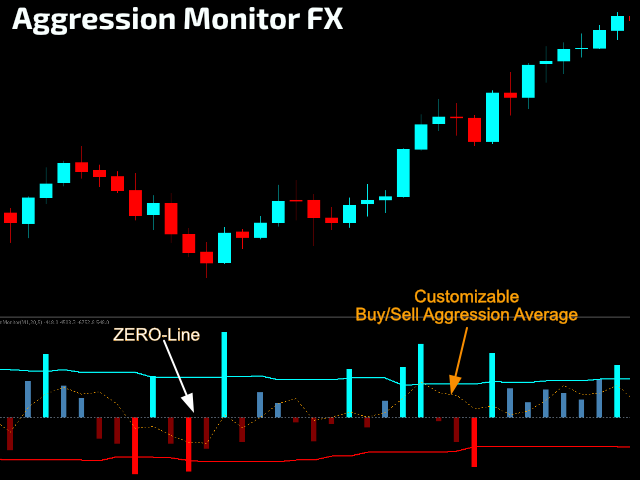
- Existen 2 líneas medias aisladas: una para la presión de COMPRA y otra para la presión de VENTA. Cuando el volumen de agresión supera la media, el histograma se ilumina.
- También hay una tercera línea media que representa el Delta de presión de COMPRA/VENTA, que puede utilizar como termómetro de la Dirección del Volumen. Puede utilizarla como referencia de potencia cuando está Por Encima/Bajo de la Línea Cero del indicador. Puedes acortar o ampliar su periodo de análisis para capturar datos para tus estrategias de ENTRADA/SALIDA.
- También puede ser muy útil para crear estrategias de Stop Loss.
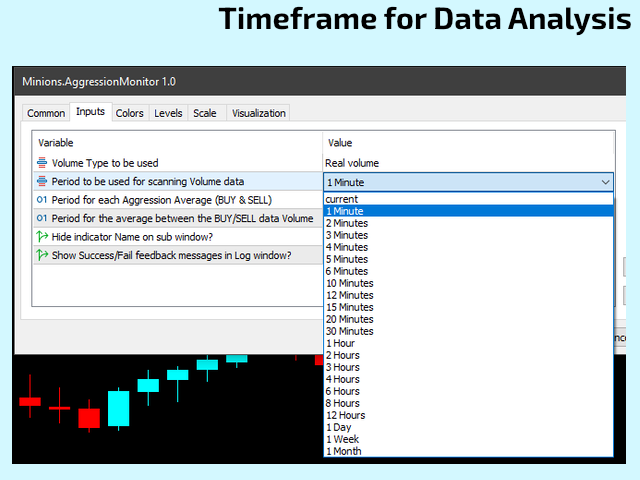
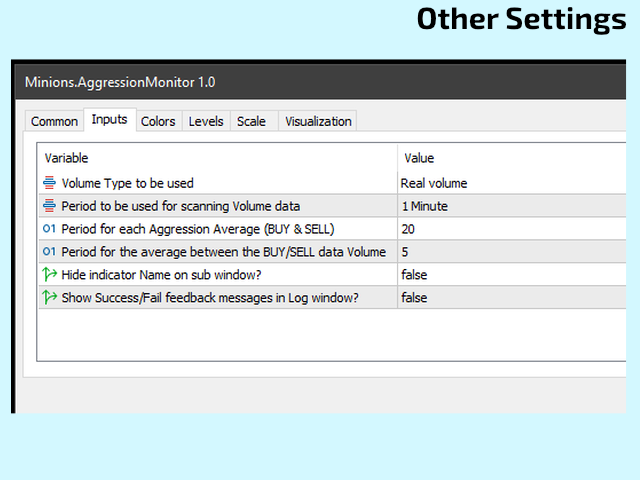
AJUSTES
- Tipo de Volumen a Utilizar - Volumen Real o Volumen Tick
- Periodo a utilizar para escanear los datos de volumen - Elija el periodo de tiempo que desee, SIEMPRE menor que el periodo de tiempo actual que se esté utilizando. Cuanto menor sea el marco temporal, mayor será la granularidad de los datos de volumen.
- Periodo para Cada Media de Agresión (COMPRA & VENTA) - La media móvil se aplicará en el lado de COMPRA y en el lado de VENTA en el histograma de Volumen.
- Periodo para la Media entre el Volumen Delta de COMPRA/VENTA - Elija el periodo para el análisis Delta.
- ¿Ocultar el Nombre del Indicador en la Sub-ventana?
- Mostrar mensajes de retroalimentación de Éxito/Fallo en la Ventana de Registro (pestaña EXPERTS)
BUFFERS PARA SU EA
Este indicador es EA Friendly, así que por favor vea abajo todos los buffers disponibles para que usted los use en su propio EA:
- #0 - Datos brutos de volumen.
- #1 - Colores aplicados sobre el histograma - NINGUNO:0 / COMPRA por debajo de su media:1 / COMPRA por encima de su media:2 / VENTA por debajo de su media:3 / VENTA por encima de su media:4
- #2 - Media móvil del lado COMPRA
- #3 - Media móvil del lado VENTAS
- #4 - Media móvil del Delta COMPRA/VENTA.
Si desea probar este indicador en una cuenta Real o Demo de forma GRATUITA, consulte las instrucciones en nuestro Blog: https://www.mql5.com/pt/blogs/post/747297 |
|---|
¿No ha encontrado la función que necesita?
Ningún producto es perfecto para todos. Si usted piensa que necesita una característica que falta de nuestro producto sólo envíenos un mensaje. Nos encantan los comentarios.
Sobre Flavio Jarabeck
Flavio Jarabeck es el propietario de MinionsLabs.com, una iniciativa empresarial centrada en aprovechar el conocimiento y la experiencia de los traders profesionales a través de robots de trading automatizados, liberándolos para buscar nuevas oportunidades y estrategias en nuevos mercados y activos.
;)