IBB Candles
- Indicatori
-
Navdeep Singh
 The momentum of money is always more potent than the gravity of logic
Free or paid, All tools are coded with intention to help traders
My tools:- - Versione: 1.3
- Aggiornato: 2 gennaio 2022
- Attivazioni: 10
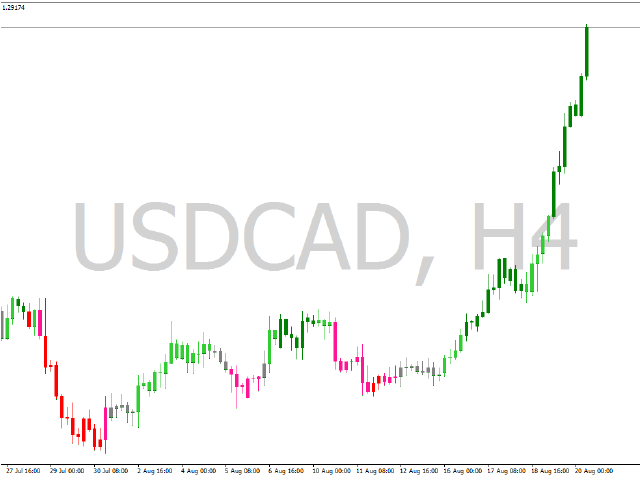
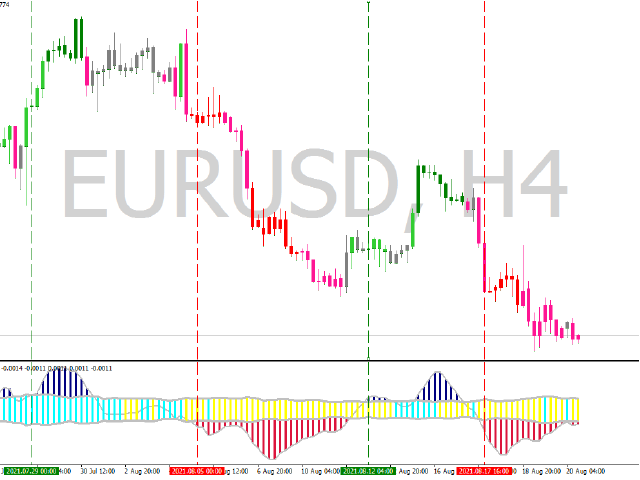
IBB Candles is a tool that is based on the concept of Inverse Bollinger Bands. It compares price relative to state of the bands and plots candles with different colors defining the current state of the market i.e range | trend | strong trend.
As the name suggests IBB(Inverse Bollinger Bands) is a technique which is completely different from the traditional Bollinger Bands and proves to be much more effective in analyzing market. This personal implementation makes this tool a more reliable option.
Main features
- Non repainting signals
- Easy to understand tool for beginners
- Parameters for signal optimization and color selection
- Works on all symbols
- Works on all timeframes
- Alerts, email & push notifications
Usage
Colors shows the direction of the trend as well as the strength of the trend. An example of using this tool for technical analysis can be seen here