Alert Creator
- Indicadores
-
Pavel Verveyko
 Writing scripts, indicators, EAs on MQL5 and MQL4.
Fast, Reliable, And High-Quality.
For all questions, please contact personal messages. - Versión: 1.4
- Actualizado: 12 agosto 2023
- Activaciones: 5
En el ajuste Alert_ID, puede asignar un nombre único al indicador, por lo que puede ejecutar varias versiones del indicador con diferentes configuraciones de alerta en el gráfico, pero sólo puede haber una tabla en el gráfico.
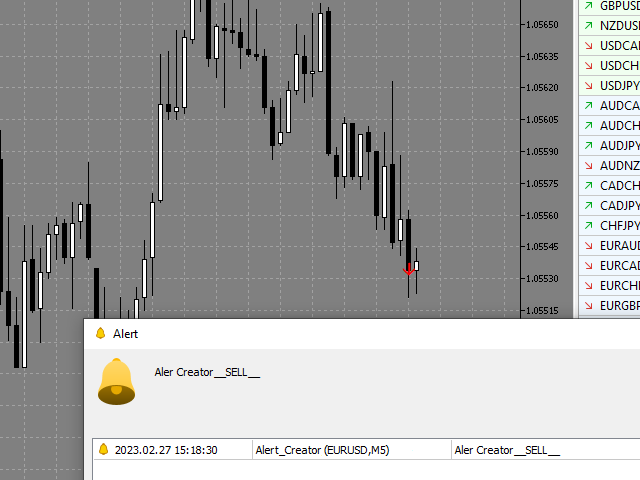
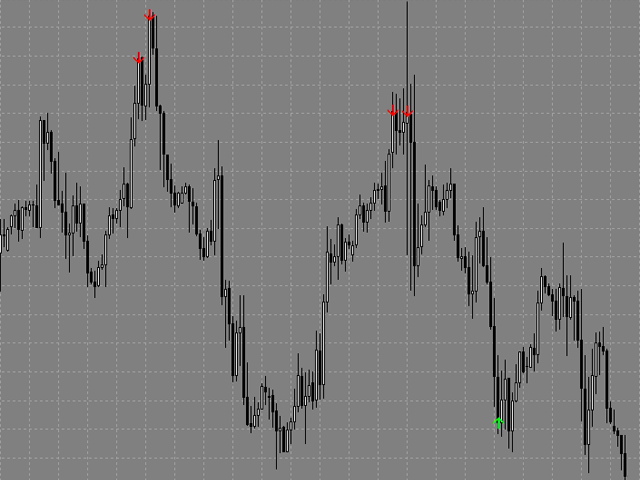
El indicador implementa: alerta estándar, notificación al terminal móvil, notificación al correo electrónico, notificación en forma de flecha.
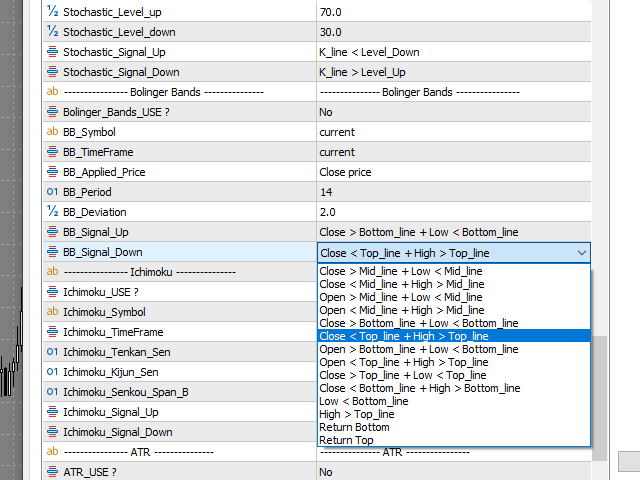
Ejemplos de condiciones:
- Cierre > MA significa que el precio de cierre es superior a la media móvil.
- Oscilador < Level_Down significa que el valor del indicador está por debajo del nivel horizontal del oscilador.
- Open > Mid_line + Low < Mid_line esto significa que el precio de apertura es superior a la línea media del indicador "BB" y el precio mínimo es inferior a la línea media del indicador "BB".
- Tenkan > Kijun + Chinkou + Kumo + Cierre > Kumo significa que se ha formado una "cruz dorada" en el indicador Ichimoku, confirmada por la línea Chinkou y el color de la nube, el precio de cierre es superior a la nube.
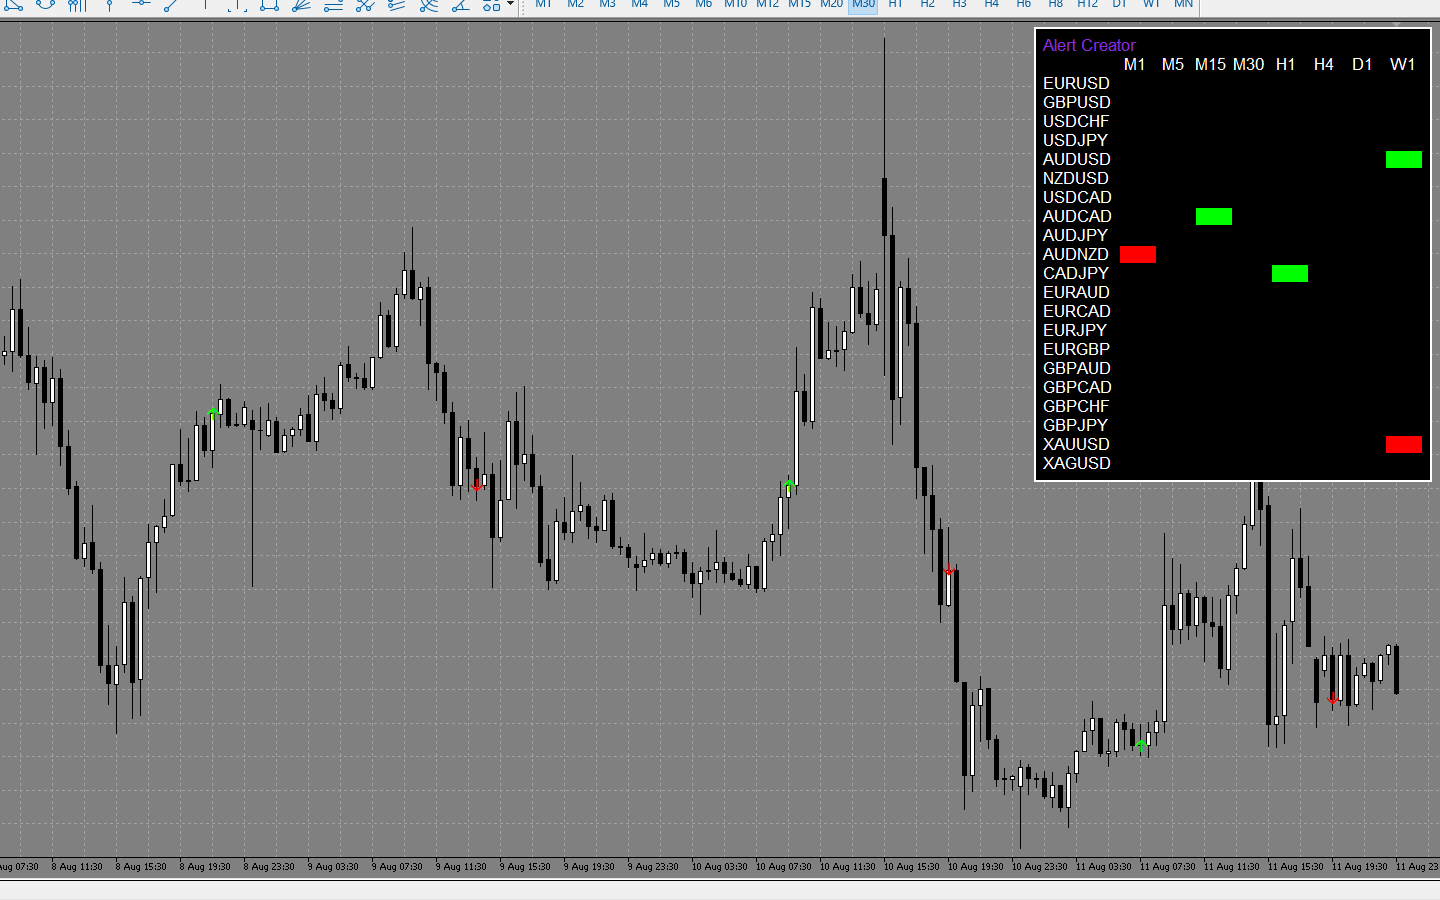
El indicador dispone de una tabla para realizar un seguimiento de otros instrumentos y periodos de tiempo.
La tabla se puede arrastrar con el ratón.
El tamaño de la tabla depende del tamaño de fuente seleccionado en los ajustes.
Al hacer clic en el rectángulo seleccionado de la tabla, se cambia el instrumento y/o el periodo de tiempo o se abre una nueva ventana de gráfico.
Si se selecciona Current_Chart en la configuración New_Chart_or_Current_Chart, el periodo de tiempo y el instrumento cambiarán a los que correspondan al rectángulo seleccionado.
Si se selecciona New_Chart en la configuración New_Chart_or_Current_Chart, se abrirá una nueva ventana con un gráfico cuyo periodo de tiempo e instrumento correspondan al rectángulo seleccionado.
En la configuración Template_name_for_New_Chart, puede especificar una plantilla de gráfico con la que se abrirá una nueva ventana.
Ajustes (aquí están los ajustes más importantes; también hay ajustes en el indicador que le permiten cambiar el diseño del "Creador de alertas" y los ajustes de los indicadores técnicos):
- indicator_USE - permite activar/desactivar un determinado indicador técnico para buscar divergencias en él.
- Table_On_Off - activar/desactivar la tabla.
- Tickers - Instrumentos a mostrar en la tabla (separados por comas).
- TimeFrames - Periodos de tiempo a mostrar en la tabla (separados por comas).
- Table_Refresh_Rate (en segundos) - la frecuencia de actualización de la tabla se mide en segundos.
- New_Chart_or_Current_Chart - el modo de abrir un nuevo gráfico: en una nueva ventana o cambiando el instrumento y el periodo de tiempo en la ventana en la que se está ejecutando el indicador.
- Template_name_for_New_Chart - el nombre de la plantilla con la que se abrirá el nuevo gráfico.