Round Numbers Levels
- Indicadores
-
Pavel Verveyko
 Writing scripts, indicators, EAs on MQL5 and MQL4.
Fast, Reliable, And High-Quality.
For all questions, please contact personal messages. - Versión: 1.2
- Actualizado: 24 octubre 2021
- Activaciones: 5
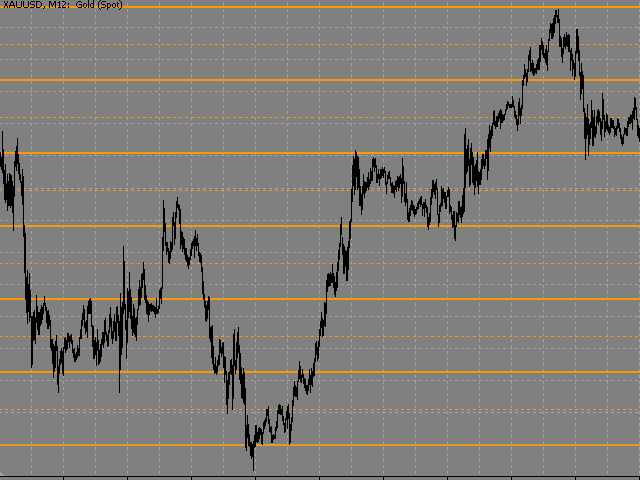
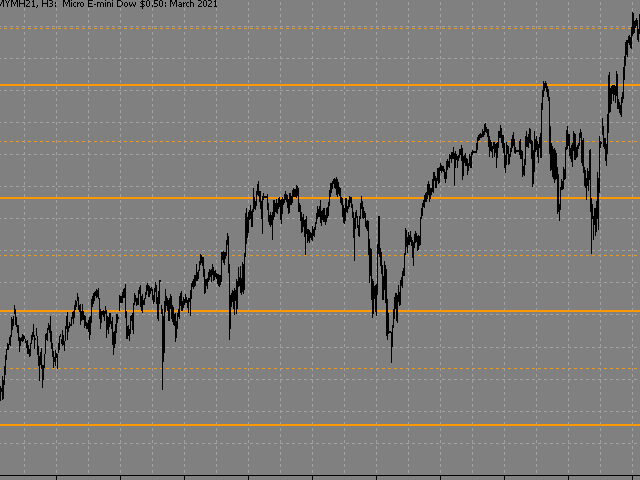
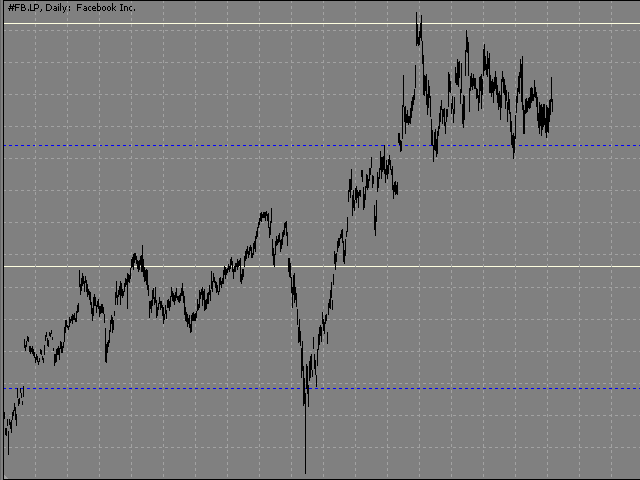
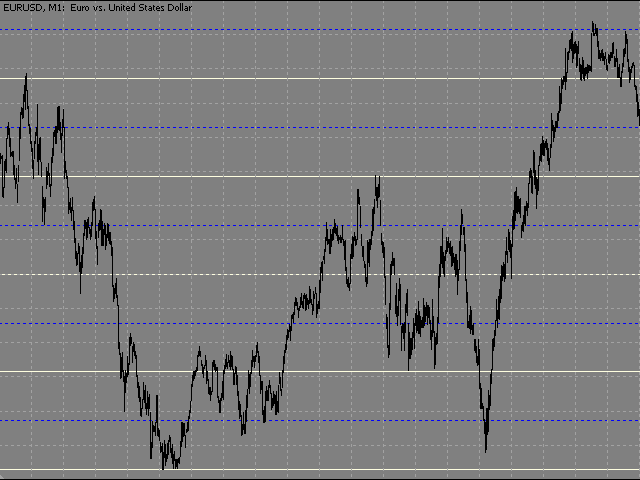
El indicador construye "niveles psicológicos": niveles de números redondos y niveles intermedios de números redondos.
Los números redondos desempeñan un papel importante en la formación de niveles de soporte y resistencia. Existe un patrón en el que la caída o el crecimiento del precio pueden detenerse en los números redondos.
El nivel cuyo precio termina en 0 es el nivel de un número redondo de primer orden.
Nivel intermedio, es el nivel entre dos niveles redondos, por ejemplo, entre 10 y 20 es el nivel 15.
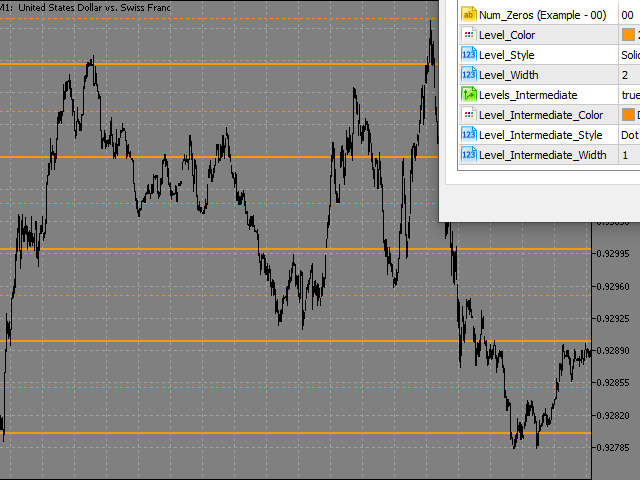
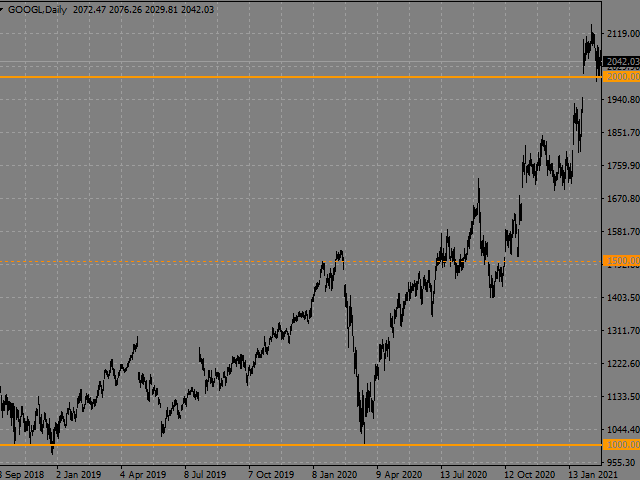
En el ajuste"Num_Zeros", puede elegir con cuántos ceros mostrar los niveles.
Hay un "botón de texto" en la pantalla para ajustar rápidamente los niveles.
Este botón le permite cambiar el número de ceros en los niveles, ocultar / mostrar niveles intermedios.
El indicador no se redibuja.
En los ajustes del indicador, puede cambiar el color, el tipo y el grosor de la línea por separado para los niveles redondos y por separado para los niveles intermedios.