Camarilla Pivots Historical
- Indicadores
- Versión: 1.0

AHORA PUEDE DESCARGAR VERSIONES GRATUITAS DE NUESTROS INDICADORES DE PAGO . ES NUESTRA FORMA DE RETRIBUIR A LA COMUNIDAD.
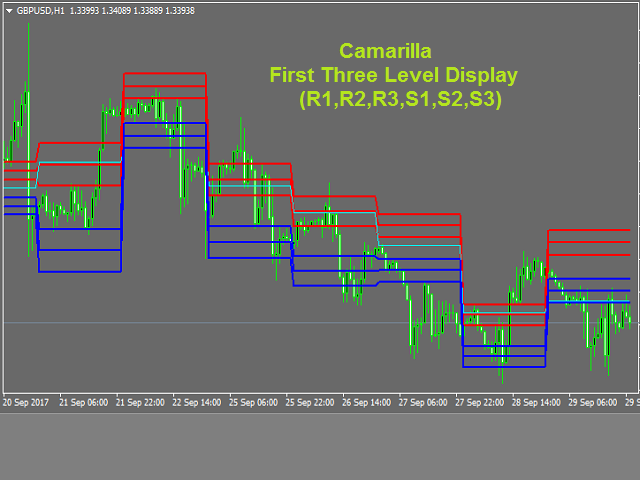
Camarilla Pivots Historical traza los datos históricos de los niveles de pivote de camarilla en el gráfico. Los niveles Camarilla Pivot fueron originados en 1989 por Nick Scott. Los niveles son utilizados como soporte primario y niveles de resistencia por los operadores intradía. Los niveles se calculan con la siguiente fórmula
- R4 = C + RANGO * 1.1/2
- R3 = C + RANGO * 1,1/4
- R2 = C + RANGO * 1,1/6
- R1 = C + RANGO * 1,1/12
- PP = (ALTO + BAJO + CIERRE) / 3
- S1 = C - RANGO * 1,1/12
- S2 = C - RANGO * 1,1/6
- S3 = C - RANGO * 1,1/4
- S4 = C - RANGO * 1,1/2
Aparte del soporte y la resistencia primarios, entre los usos más comunes de los niveles se incluyen la gestión de riesgos y la negociación intradía.
Gestión del riesgo
Cuando el precio se acerca a los niveles S3 y R3, es posible que se produzca un cambio de tendencia inminente, por lo que los operadores suelen intentar salir de sus posiciones en estos niveles.
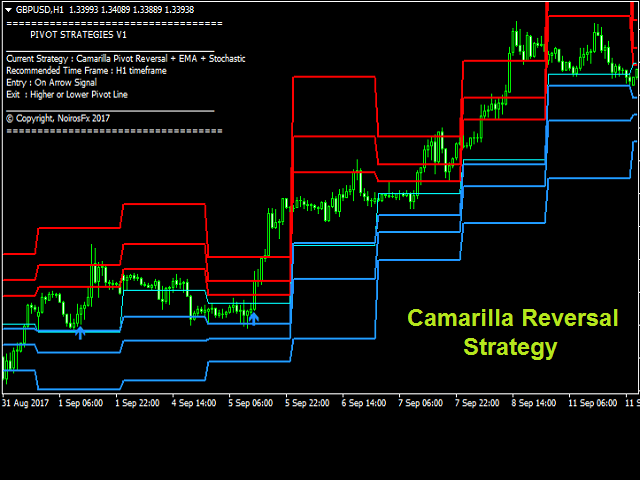
Inversión de Cams
Dado que los operadores esperan una posible reversión en los niveles S3 y R3, también pueden realizar operaciones en la dirección de reversión en estos niveles cuando se alcanzan. Por lo tanto, en un nivel S3 un operador del día espera tomar una operación de compra y una operación de venta en un nivel R3.
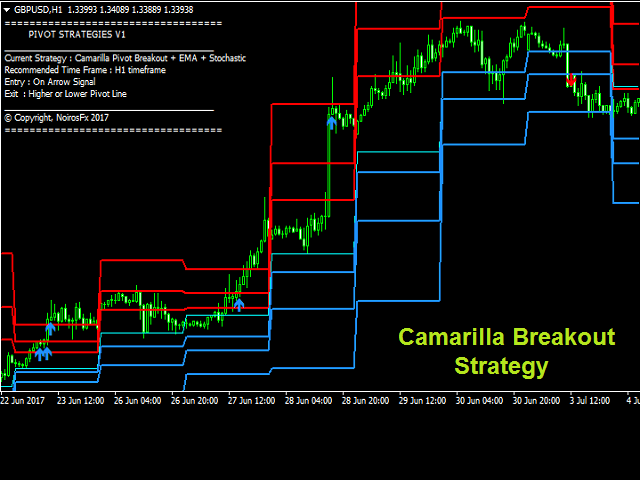
Trading Cam Breakouts
Si el precio rompe los cuartos niveles (R4 y S4), el precio puede estar dirigiéndose en una nueva dirección, por lo que las operaciones buscan en estos niveles posibles señales de ruptura. Por lo tanto, puede comprar una operación en una ruptura R4 y vender una operación en una ruptura S4.
Entrada
- GMT TimeOffset: Utilice esta opción para sincronizar la hora de su plataforma para el cálculo de la Línea Pivote.
- Niveles a Mostrar: Puede mostrar los tres primeros niveles de pivote (R1,R2,R3,S1,S2,S3) o los tres últimos niveles de pivote (R3,R4,R5,S3,S4,S5).
- Mostrar Textos de Nivel: Activar/Desactivar etiquetas de Pivote
- Color del Texto de Resistencia: Color de la Etiqueta de Resistencia
- Color del Texto de Soporte: Color de la Etiqueta de Soporte
Somos Sociales
Únase a nuestro canal de Telegram para obtener señales diarias gratuitas y un soporte más rápido de nuestros productos.


very good