Crazy Cloud MT4

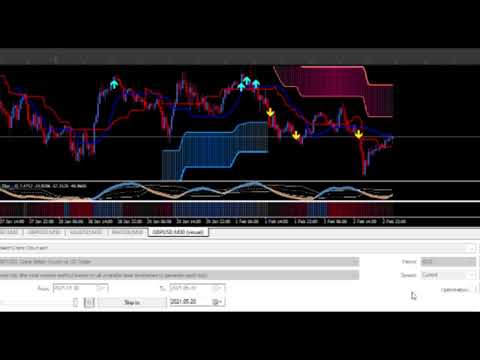
I make this indicator to help you for setting effective stoploss and getting more signals from following trends. This indicator helps to tell the trends and sideway, when 2 lines stand above of blue cloud, it means uptrend. When 2 lines stand above red cloud, it means down trend, the other else, it means sideway market. For taking order, you have to wait the arrows. You also need to see the cloud position, if the cloud's res, you have to wait the yellow arrow for selling order. If the cloud's blue, you have to wait the blue arrow for buyying order.

For free version : You can trade on GBPUSD and GBPJPY in M30 Time Frame
https://www.mql5.com/en/market/product/67266?source=Site+Market+MT4+Search+Rating004%3acrazy+cloud

Video Crazy Cloud MT4
추천 제품
Infinity Trend Pro
Yaroslav Varankin
1 (1)
This is a trend indicator without redrawing Developed instead of the binary options strategy (by the color of the Martingale candlestick) Also works well in forex trading When to open trades (binary options) A signal will appear in the place with a candle signaling the current candle It is recommended to open a deal for one candle of the current timeframe M1 and M5 When a blue dot appears, open a deal up When a red dot appears, open a trade down. How to open trades on Forex. When a signal is rec
The Th3Eng PipFinite indicator is based on a very excellent analysis of the right trend direction with perfect custom algorithms. It show the true direction and the best point to start trading. With StopLoss point and Three Take Profit points. Also it show the right pivot of the price and small points to order to replace the dynamic support and resistance channel, Which surrounds the price. And Finally it draws a very helpful Box on the left side on the chart includes (take profits and Stop loss
Forex Gump
Andrey Kozak
2.4 (5)
Forex Gump is a fully finished semi-automatic trading system. In the form of arrows, signals are displayed on the screen for opening and closing deals. All you need is to follow the instructions of the indicator. When the indicator shows a blue arrow, you need to open a buy order. When the indicator shows a red arrow, you need to open a sell order. Close orders when the indicator draws a yellow cross. In order to get the most effective result, we recommend using the timeframes H1, H4, D1. There
Owl smart levels
Sergey Ermolov
4.24 (37)
MT5 버전  |   FAQ Owl Smart Levels Indicator 는   Bill Williams 의 고급 프랙탈, 시장의 올바른 파동 구조를 구축하는 Valable ZigZag, 정확한 진입 수준을 표시하는 피보나치 수준과 같은 인기 있는 시장 분석 도구를 포함하는 하나의 지표 내에서 완전한 거래 시스템입니다. 시장과 이익을 취하는 장소로. 전략에 대한 자세한 설명 표시기 작업에 대한 지침 고문-거래 올빼미 도우미의 조수 개인 사용자 채팅 ->구입 후 나에게 쓰기,나는 개인 채팅에 당신을 추가하고 거기에 모든 보너스를 다운로드 할 수 있습니다 힘은 단순함에 있습니다! Owl Smart Levels   거래 시스템은 사용하기 매우 쉽기 때문에 전문가와 이제 막 시장을 연구하고 스스로 거래 전략을 선택하기 시작한 사람들 모두에게 적합합니다. 전략 및 지표에는 눈에 보이지 않는 비밀 공식 및 계산 방법이 없으며 모든 전략 지표는 공개되어 있습니다. Owl Smart Leve
Naturu MT4
Ivan Stefanov
“Naturu”는 자연의 대칭성을 알고리즘으로 활용하는 수동 인디케이터입니다. 간단한 전략과 숨겨진 지혜로 시장을 제패하세요! 인디케이터를 로드하면 위(Top)와 아래(Bottom) 두 개의 라인이 표시됩니다. 라인을 한 번 클릭해 활성화한 후, 이동하고 싶은 캔들 위를 클릭하면 그 위치로 이동합니다. 사용자가 고점과 저점을 지정하면, 인디케이터가 자동으로 계산합니다: 마젠타 색 영역: 상승(불) 세력과 하락(곰) 세력의 관심이 가장 가까워져서 지지/저항이 될 가능성이 큰 구간 회색 영역: 다음 관심 구간 아쿠아 색 실선: 상승 세력의 목표가 골드 색 실선: 하락 세력의 목표가 수동 인디케이터는 실시간 시장 상황과 개인의 직관에 따라 레벨을 자유롭게 조정할 수 있는 완전한 제어력과 유연성을 제공합니다. 직접 가격 움직임을 분석함으로써 지지·저항과 패턴 형성을 본질적으로 이해할 수 있습니다. 인간의 판단을 통해 자동 시스템이 놓치거나 오해하기 쉬운 ‘노이즈’를 걸러내어 잘못된 신호를
Fibonacci retracement and extension line drawing tool Fibonacci retracement and extended line drawing tool for MT4 platform is suitable for traders who use  golden section trading Advantages: There is no extra line, no too long line, and it is easy to observe and find trading opportunities Trial version: https://www.mql5.com/zh/market/product/35884 Main functions: 1. Multiple groups of Fibonacci turns can be drawn directly, and the relationship between important turning points can be seen
캔들의 종가를 예측하는 지표입니다. 지표는 주로 D1 차트에서 사용하기 위한 것이. 이 지표는 전통적인 외환 거래와 바이너리 옵션 거래 모두에 적합합니다. 지표는 독립형 거래 시스템으로 사용하거나 기존 거래 시스템에 추가로 사용할 수 있습니다. 이 표시기는 현재 양초를 분석하여 양초 본체 내부의 특정 강도 요인과 이전 양초의 매개변수를 계산합니다. 따라서 지표는 시장 움직임의 추가 방향과 현재 양초의 종가를 예측합니다. 이 방법 덕분에 지표는 단기 및 중장기 거래 모두에 적합합니다. 지표를 사용하면 시장 상황을 분석하는 동안 지표가 생성할 잠재적 신호의 수를 설정할 수 있습니다. 표시기 설정에는 이를 위한 특별한 매개변수가 있습니다. 또한 인디케이터는 새로운 신호에 대해 차트의 메시지 형태, 이메일 및 PUSH 알림 형태로 알릴 수 있습니다. 구매 후 저에게 꼭 써주세요! 나는 당신에게 지표와 거래에 대한 나의 추천을 줄 것입니다! 또한 보너스를 받으세요!
Trendiness Index
Libertas LLC
5 (3)
"The trend is your friend" is one of the best known sayings in investing, because capturing large trendy price movements can be extremely profitable. However, trading with the trend is often easier said than done, because many indicators are based on price reversals not trends. These aren't very effective at identifying trendy periods, or predicting whether trends will continue. We developed the Trendiness Index to help address this problem by indicating the strength and direction of price trend
PABT Pattern Indicator - it's classical system one of the signal patterns. Indicator logic - the Hi & Lo of the bar is fully within the range of the preceding bar, look to trade them as pullback in trend. In the way if indicator found PABT pattern it's drawing two lines and arrow what showing trend way.  - First line - it's entry point and drawing at: 1. On the high of signal bar or on middle of the signal bar (depending from indicator mode) for buy; 2. On the low of signal bar or on middle of t
For sure, this indicator has become very popular amongst traders. Through coding this indicator will give you the most accurate levels possible for your trading analysis. We have also added in the ability for you to receive alerts when the price breaks above or below a Support or Resistance lines! HOW TO USE The red rectangles represent your resistance/supply zone. The green rectangles represent your support/demand zone.  BONUS FEATURES We coded this indicator with the ability to switch between
Cosmic Diviner X Planet
Olena Kondratenko
4 (2)
This unique multi-currency strategy simultaneously determines the strength of trends and market entry points, visualizing this using histograms on the chart. The indicator is optimally adapted for trading on the timeframes М5, М15, М30, Н1. For the convenience of users, the indicator renders the entry point (in the form of an arrow), recommended take profit levels (TP1, TP2 with text labels) and the recommended Stop Loss level. The take profit levels (TP1, TP2) are automatically calculated for
PipFinite Trend PRO
Karlo Wilson Vendiola
4.88 (2247)
Breakthrough Solution For Trend Trading And Filtering With All Important Features Built Inside One Tool! Trend PRO's smart algorithm detects the trend, filters out market noise and gives entry signals with exit levels. The new features with enhanced rules for statistical calculation improved the overall performance of this indicator. Important Information Revealed Maximize the potential of Trend Pro, please visit www.mql5.com/en/blogs/post/713938 The Powerful Expert Advisor Version Automatin
EZZ Zig Zag MT4
Paulo Rocha
5 (1)
EZZ Elite Zig Zag is an indicator for the MetaTrader 4 terminal. This indicator traces the peak of the trend based on the market reversal, thus showing various opportunities in the financial market. EZZ Elite Zig Zag is a visual tool, intuitive, and easy to understand and use.  Test it Yourself by Downloading it for Free. Author Paulo Rocha all rights reserved
Fourteen plus nine TD Sequential
MOHAMMED IMAD HUSSEIN BASSEE
Fourteen plus nine What is it for? Applying Tom DeMark’s TD Sequential serves the purpose of identifying a price point where an uptrend or a downtrend exhausts itself and reverses. . What are the main components of TD Sequential? TD Sequential has two parts – TD Setup and TD Countdown. The first phase of TD Sequential starts with a TD Setup and is completed with a 9 count. When the 9 count is completed, it is at that point, a price pause, price pullback, or reversal is likely. It is also at tha
Crypto_Forex 지표 "Morning Star pattern" for MT4. - 지표 "Morning Star pattern"은 가격 액션 거래에 매우 강력한 지표입니다. 다시 칠할 필요 없고 지연도 없습니다. - 지표는 차트에서 강세 Morning Star 패턴을 감지합니다. 차트에 파란색 화살표 신호가 있습니다(그림 참조). - PC, 모바일 및 이메일 알림이 있습니다. - 또한 형제인 약세 "Evening Star pattern" 지표도 사용할 수 있습니다(아래 링크를 따라가세요). - 지표 "Morning Star pattern"은 지지/저항 수준과 결합하기에 매우 좋습니다. 여기를 클릭하여 고품질 트레이딩 로봇과 지표를 확인하세요! 이것은 이 MQL5 웹사이트에서만 제공되는 오리지널 제품입니다.
Point61 Indicator
Evgeniy Machok
5 (1)
The Point61 indicator is the result of many years of monitoring of price behavior of currency pairs and metals. It is not a secret, that in times of uncertainty, traders are looking for possible levels of support and resistance - the point, where price should stop its movement. There are 2 possible scenarios at these points: 1. Reverse (correction) to the opposite direction; 2. Breakthrough to continue movement. Very often these points are used to set stop orders - TakeProfit or StopLoss
Signal trend indicator. Detects the direction of the trend and is coloured accordingly.  Has built in audible and visual alerts when trends change. Can send notifications to your phone or email. Allows Trend and Counter-Trend trading. Works on all timeframes, all currency pairs, metals, indices and cryptocurrencies. Can be used with binary options. Distinctive features No re-drawing; Simple and clear settings; Four types of alerts; Works on all timeframes and all trading tools; Suitable
PinBar Pattern mk
DMITRII GRIDASOV
MT4용 Crypto_Forex 지표 PINBAR 패턴, 재도색 및 지연 없음. - "PINBAR 패턴" 지표는 가격 변동 거래에 매우 강력한 지표입니다. - 이 지표는 차트에서 다음과 같은 핀바를 감지합니다. - 상승 핀바 - 차트에 파란색 화살표 신호(그림 참조). - 하락 핀바 - 차트에 빨간색 화살표 신호(그림 참조). - PC, 모바일 및 이메일 알림 기능 제공. - "PINBAR 패턴" 지표는 지지/저항 레벨과 결합하기 매우 좋습니다. ................................................................................ 여기를 클릭하여 고품질 트레이딩 로봇과 지표를 확인하세요! MQL5 웹사이트에서만 제공되는 오리지널 상품입니다.
Gold Titan King Scalper
Dodong Christian Arnon
Indicator Description GOLD TITAN KING SIGNAL INDICATOR High-Precision Gold Scalping Buy/Sell Signals – Manual Trading Assistant Overview The Gold Titan King Signal Indicator is a manual trading assistant tool designed for high-frequency scalping on Gold (XAUUSD) and other major pairs. It generates clear BUY/SELL signals with precise entry levels, along with adjustable Stop Loss and Take Profit levels displayed directly on the chart. ️ This tool is NOT an EA. It does not execute trades
Trade with Gann on your side!! MASTER CIRCLE 360 CIRCLE CHART, originally created by Gann admitted that this is “The Mother of all charts”. It is one of the last studies that this great trader left for us. The numeric tab le is apparently quite simple like all the tables and is based on square numbers, the SQUARE OF 12 and is by evolution, one of the most important square numbers. Here we can find CYCLE, PRICE AND TIME thanks to angles and grades, to show past and future support and resistance.
Alpha Trend sign has been a very popular trading tool in our company for a long time. It can verify our trading system and clearly indicate trading signals, and the signals will not drift. Main functions: Based on the market display of active areas, indicators can be used to intuitively determine whether the current market trend belongs to a trend market or a volatile market. And enter the market according to the indicator arrows, with green arrows indicating buy and red arrows indicating se
Heiken Ashi candle chart is an improved version of The Japanese candle chart, which can effectively filter the market "noise" of the Japanese candle chart. It is favored by many traders for its simplicity and intuition. For trend traders, the HA candle chart is a magic tool. Unlike the traditional Japanese candle chart, Heikenashi does not reflect the opening price, high price, low price and closing price of the market. Instead, Heikenashi calculates the value of a single K line in the dominant
Chart Patterns Detect 15 patterns (Ascending Triangle, Descending Triangle, Rising Wedge, Falling Wedge, Bullish Flag, Bearish Flag, Bullish Rectangle, Bearish Rectangle Symmetrical triangle, Head and Shoulders, Inverted Head and Shoulders, Triple top, Triple Bottom, Double Top, Double Bottom) Use historical data to calculate the probability of each pattern to succeed (possibility to filter notification according to the chance of success) gives graphic indication about the invalidation level and
Stepping Trend
Mpendulo Chiliza
The Stepping Trend Indicator     The Steppi ng Trend indicator uses the  average true range  (ATR indicator) in its calculation. This gives you control to set your own average true range period, I set the Default as 10.   Indicator Details. Green Arrow Up: This means you are at the starting point of a new bullish trend, it’s time to buy.   Red  Arrow  Down : This means you are at the starting point of a new  bearish  trend, it’ s time to sell .   What if you miss the Arrow Signal?   No prob
RSI Speed mp
DMITRII GRIDASOV
MT4용 Crypto_Forex 지표 "RSI SPEED" - 훌륭한 예측 도구, 재도색 불필요 - 이 지표는 물리학 방정식을 기반으로 계산됩니다. RSI SPEED는 RSI 자체의 1차 미분값입니다. - RSI SPEED는 주요 추세 방향으로 스캘핑 진입에 유용합니다. - HTF MA(그림 참조)와 같은 적절한 추세 지표와 함께 사용하세요. - RSI SPEED 지표는 RSI 자체의 방향이 얼마나 빨리 변하는지를 보여주며, 매우 민감합니다. - 모멘텀 거래 전략에는 RSI SPEED 지표 사용을 권장합니다. RSI SPEED 지표 값이 0보다 작으면 가격 모멘텀이 하락하고, 0보다 크면 가격 모멘텀이 상승합니다. - 모바일 및 PC 알림 기능이 내장되어 있습니다. 여기를 클릭하여 고품질 트레이딩 로봇과 지표를 확인하세요! 본 제품은 MQL5 웹사이트에서만 제공되는 정품입니다.
Laser Trend
Nicolas Zouein
The trend is your friend! This is what this indicator is all about. Follow this famous saying and be safe. Characteristics: Buy/Sell signals fixed on the close of a bar. Works on all symbols and all timeframes. Clear visual market trend laser line, Buy/Sell signal arrows, market strength meter, TP1 & TP2 boxes. Visual signals when to enter, when to exit the market. No repainting. Compatible with Flexible EA for trading automation. (Ask for a free set file optimized to perform 2010-2018) Parame
This indicator is another variant of the famous powerful indicator Fibonacci-SS https://www.mql5.com/en/market/product/10136 but has different behaviour in placing Pending Order and TP Line. Automatically places Fibonacci retracement lines from the last highest and lowest visible bars on the chart with: An auto Pending Order (Buy/Sell). Taking Profit 1, Taking Profit 2 is pivot point and Taking Profit 3 for extended reward opportunity. The best risk and reward ratio. Simple and powerful indicat
Noize Absorption Index MT4
Ekaterina Saltykova
5 (1)
Noize Absorption Index - is the manual trading system that measures the difference of pressure between bears forces and bulls forces. Green line - is a noize free index that showing curent situation. Zero value of index shows totally choppy/flat market.Values above zero level shows how powerfull bullish wave is and values below zero measures bearish forces.Up arrow appears on bearish market when it's ready to reverse, dn arrow appears on weak bullish market, as a result of reverse expectation. S
ZhiBiCCI MT4
Qiuyang Zheng
[ZhiBiCCI] indicators are suitable for all cycle use, and are also suitable for all market varieties. [ZhiBiCCI] Green solid line is a reversal of bullish divergence. The green dotted line is a classic bullish divergence. [ZhiBiCCI] The solid line to the red is a reverse bearish divergence. The red dotted line is a classical bearish divergence. [ZhiBiCCI] can be set in the parameters (Alert, Send mail, Send notification), set to (true) to send instant signals to the alarm window, email, insta
Next level of trend trading here. Possibility 75%, the indicator analyzes the current market to determine short (small dot), middle (circle with a dot inside) and long (cross with a circle and a dot inside) trends.  Wingdings characters of  Aqua color represents the beginning of the UP trend. Wingdings characters of  Orange color represents the beginning of the DOWN trend. Possibility 75% Indicator will improve your trading in the world of forex, commodities, cryptocurrencies and indices.
이 제품의 구매자들이 또한 구매함
Meravith
Ivan Stefanov
5 (1)
이 인디케이터는 각 지점에서 볼륨을 분석하고 해당 볼륨에 대한 시장의 피로 레벨을 계산합니다. 이 인디케이터는 세 개의 라인으로 구성됩니다: 강세 볼륨 피로 라인 약세 볼륨 피로 라인 시장 추세를 나타내는 라인. 이 라인은 시장이 강세인지 약세인지에 따라 색이 변합니다. 원하는 시작 지점에서 시장을 분석할 수 있습니다. 볼륨 피로 라인에 도달하면 다음 분석을 시작할 새 지점을 식별하세요. 트렌드와 수정 모두 분석할 수 있습니다. 좋은 접근 방법은 트렌드 라인에 도달하거나 고점 또는 저점에 도달할 때마다 인디케이터를 이동시키는 것입니다. 트렌드 라인과 볼륨 피로 라인 간의 거리가 클수록 해당 방향의 볼륨이 더 큽니다. 트렌드 라인은 주문을 열기 위한 장소로 사용할 수 있으며, 피로 라인은 수익을 얻는 데 사용됩니다. 이 시스템은 정말 독특하지만 매우 직관적입니다. 시장에는 비슷한 제품이 없습니다. 사용에 제한이 없습니다. 모든 시장과 모든 시간 프레임에서 적용할 수 있습니다. 중요:
현재 20% 할인 ! 초보자 또는 전문가 트레이더를 위한 최고의 솔루션! 이 대시보드 소프트웨어는 28개의 통화 쌍에서 작동합니다. 2가지 주요 지표(Advanced Currency Strength 28 및 Advanced Currency Impulse)를 기반으로 합니다. 전체 Forex 시장에 대한 훌륭한 개요를 제공합니다. 고급 통화 강도 값, 통화 이동 속도 및 모든(9) 시간대의 28 Forex 쌍에 대한 신호를 보여줍니다. 추세 및/또는 스캘핑 기회를 정확히 파악하기 위해 차트의 단일 지표를 사용하여 전체 시장을 볼 수 있을 때 거래가 어떻게 개선될지 상상해 보십시오! 잠재적인 거래를 식별하고 확인하면서 강력한 통화와 약한 통화를 더욱 쉽게 식별할 수 있도록 이 지표에 기능을 내장했습니다. 이 표시기는 통화의 강세 또는 약세가 증가 또는 감소하는지 여부와 모든 시간대에서 수행되는 방식을 그래픽으로 보여줍니다. 추가된 새로운 기능은 현재 시장 조건 변화에 적응하는
이 지표는 실제 거래에 완벽한 자동 파동 분석 지표입니다! 사례... 참고:   웨이브 그레이딩에 서양식 이름을 사용하는 데 익숙하지 않습니다. Tang Lun(Tang Zhong Shuo Zen)의 명명 규칙의 영향으로 기본 웨이브를   펜   으로 명명하고 2차 웨이브 밴드를   세그먼트   로 명명했습니다. 동시에, 세그먼트에는 추세 방향이 있습니다.   주요 추세 세그먼트에는   이름이 지정되지만(이 이름 지정 방법은 향후 노트에서 사용됩니다. 먼저 말씀드리겠습니다.) 알고리즘은 굴곡 이론과 거의 관련이 없으므로 그렇게 해서는 안 됩니다. 이는 나의 시장 분석을   통해 요약된 끊임없이 변화하고 복잡한 운영 규칙을   반영합니다. 밴드는 더 이상 사람마다 다르지 않도록 표준화되고 정의되었습니다. 인위적인 간섭의 드로잉 방법은 시장 진입을 엄격하게 분석하는 데 핵심적인 역할을 합니다. 이 지표를 사용하는 것은 거래 인터페이스의 미학을 개선하고 원래의 K-line 거래를
Looking for a powerful yet lightweight swing detector that accurately identifies market structure turning points? Want clear, reliable buy and sell signals that work across any timeframe and any instrument? Buy Sell Arrow MT Swing is built exactly for that — precision swing detection made simple and effective. This indicator identifies Higher Highs (HH) , Higher Lows (HL) , Lower Highs (LH) , and Lower Lows (LL) with remarkable clarity. It is designed to help traders easily visualize market str
Dynamic Forex28 Navigator
Bernhard Schweigert
4.43 (7)
Dynamic Forex28 Navigator - 차세대 외환 거래 도구. 현재 49% 할인. Dynamic Forex28 Navigator는 오랫동안 인기 있는 지표의 진화형으로, 세 가지의 힘을 하나로 결합했습니다. 고급 통화 Strength28 지표(695개 리뷰) + 고급 통화 IMPULSE with ALERT(520개 리뷰) + CS28 콤보 신호(보너스). 지표에 대한 자세한 정보 https://www.mql5.com/en/blogs/post/758844 차세대 Strength 지표는 무엇을 제공합니까?  원래 지표에서 좋아했던 모든 것이 새로운 기능과 더 높은 정확도로 강화되었습니다. 주요 기능: 독점적인 통화 Strength 공식.  모든 시간대에 걸쳐 부드럽고 정확한 강도선. 추세와 정확한 진입을 식별하는 데 이상적입니다. 역동적인 시장 피보나치 수준(시장 피보나치).  이 지표에만 있는 고유한 기능. 가격 차트가 아닌 통화 강도에 피보나치가 적용됩니다.
RelicusRoad Pro
Relicus LLC
4.63 (106)
훌륭한 백테스트 , 환상적인 숫자로 증명된 실계좌 성능 , 그리고 온갖 통계 를 가진 트레이딩 지표를 얼마나 많이 구매했지만, 사용 후에 결국 계좌를 날려버린 적이 있나요? 신호 자체만으로는 신뢰할 수 없습니다. 애초에 그 신호가 왜 나타났는지 알아야 하며, 이것이 바로 RelicusRoad Pro가 가장 잘하는 일입니다! 사용자 설명서 + 전략 + 교육 비디오 + VIP 접근 권한이 있는 비공개 그룹 + 모바일 버전 사용 가능 시장을 바라보는 새로운 방법 RelicusRoad는 외환, 선물, 암호화폐, 주식 및 지수를 위한 세계에서 가장 강력하고 최고의 트레이딩 지표 이며, 트레이더가 계좌를 성장 시키는 데 필요한 모든 정보와 도구를 제공합니다. 저희는 초보자 부터 고급 트레이더까지 모든 트레이더가 성공 할 수 있도록 기술적 분석 과 트레이딩 계획 을 제공합니다. 이것은 미래 시장을 예측 하기에 충분한 정보를 제공하는 핵심 트레이딩 지표 입니다. 저희는 차트에 여러 다른 지표
OrderFlow Absorption – MT4용 전문 델타 & 흡수 신호 인디케이터 OrderFlow Absorption으로 진정한 오더플로우 분석의 힘을 경험하세요. MetaTrader 4를 위한 궁극의 델타 히스토그램 및 흡수 신호 인디케이터입니다. 가격 움직임의 이면에서 실제로 무슨 일이 일어나는지 알고 싶은 트레이더를 위해 설계된 이 도구는, 시장을 움직이는 숨겨진 매수/매도 압력과 흡수 이벤트를 드러냅니다. 주요 기능 델타 히스토그램 시각화:   매수와 매도 압력을 색상별 히스토그램으로 즉시 확인할 수 있습니다. 흡수 신호 감지:   고급 로직으로 강세 및 약세 흡수 이벤트를 식별하여 반전 신호를 미리 알려줍니다. 차트 마커:   흡수 신호가 차트에 직접 표시되어 시각적으로 쉽게 확인할 수 있습니다. 팝업 알림:   새로운 흡수 신호가 발생하면 실시간으로 알림을 받을 수 있습니다. 사용자 지정 임계값:   약한 신호는 필터링하고, 확률이 높은 기회에 집중할 수 있습니다.
Dynamic Scalper System
Vitalyi Belyh
5 (1)
" Dynamic Scalper System " 지표는 추세 파동 내에서 스캘핑 방식으로 거래하도록 설계되었습니다. 주요 통화쌍 및 금에서 테스트되었으며, 다른 거래 상품과의 호환성이 가능합니다. 추가적인 가격 변동 지원을 통해 추세에 따라 단기 포지션 진입 신호를 제공합니다. 지표의 원리 큰 화살표는 추세 방향을 결정합니다. 작은 화살표 형태의 스캘핑 신호를 생성하는 알고리즘은 추세 파동 내에서 작동합니다. 빨간색 화살표는 상승 방향을, 파란색 화살표는 하락 방향을 나타냅니다. 민감한 가격 변동선은 추세 방향으로 그려지며, 작은 화살표의 신호와 함께 작용합니다. 신호는 다음과 같이 작동합니다. 적절한 시점에 선이 나타나면 진입 신호가 형성되고, 선이 있는 동안 미결제 포지션을 유지하며, 완료되면 거래를 종료합니다. 권장되는 작업 시간대는 M1~H4입니다. 화살표는 현재 캔들에 형성되며, 다음 캔들이 이미 시작되었더라도 이전 캔들의 화살표는 다시 그려지지 않습니다. 입력 매개
The BB Reversal Arrows technical trading system has been developed to predict reverse points for making retail decisions. The current market situation is analyzed by the indicator and structured for several criteria: the expectation of reversal moments, potential turning points, purchase and sale signals. The indicator does not contain excess information, has a visual understandable interface, allowing traders to make reasonable decisions. All arrows appear to close the candle, without redrawin
NAM Order Blocks
NAM TECH GROUP, CORP.
3.67 (3)
MT4 Multi-timeframe Order Blocks detection indicator. Features - Fully customizable on chart control panel, provides complete interaction. - Hide and show control panel wherever you want. - Detect OBs on multiple timeframes. - Select OBs quantity to display. - Different OBs user interface. - Different filters on OBs. - OB proximity alert. - ADR High and Low lines. - Notification service (Screen alerts | Push notifications). Summary Order block is a market behavior that indicates order collection
The Nihilist 5.0 Indicator includes Forexalien and Nihilist Easy Trend trading strategies and systems. It is composed of an MTF Dashboard where you can analyze the different input possibilities of each strategy at a glance. It has an alert system with different types of configurable filters. You can also configure which TF you want to be notified on your Metatrader 4 platform and Mobile application The indicator has the option to view how could be a TP and SL by using ATR or fixed points, even w
Introducing the Delta Volume Profile Indicator - Unleash the Power of Institutional Precision!  Technical Indicator: Are you ready to trade like the pros? The Delta Volume Profile Indicator is no ordinary tool. It’s a high-precision, cutting-edge indicator that puts the power of institutional-grade trading in your hands. This unique indicator analyses delta volume distribution in real-time, revealing the market's hidden buy/sell imbalances that the biggest financial institutions rely on to antic
The Super Arrow Indicator provides non-repainting buy and sell signals with exceptional accuracy. Key Features No repainting – confirmed signals remain fixed Clear visual arrows: green for buy, red for sell Real-time alerts via pop-up, sound, and optional email Clean chart view with no unnecessary clutter Works on all markets: Forex, gold, oil, indices, crypto Adjustable Parameters TimeFrame Default: "current time frame" Function: Sets the time frame for indicator calculation Options: Can be set
Beast Super Signal
Dustin Vlok
4.73 (89)
수익성 있는 거래 기회를 쉽게 식별하는 데 도움이 되는 강력한 외환 거래 지표를 찾고 계십니까? Beast Super Signal보다 더 이상 보지 마십시오. 사용하기 쉬운 이 추세 기반 지표는 시장 상황을 지속적으로 모니터링하여 새로운 개발 추세를 찾거나 기존 추세에 뛰어들 수 있습니다. Beast Super Signal은 모든 내부 전략이 정렬되고 서로 100% 합류할 때 매수 또는 매도 신호를 제공하므로 추가 확인이 필요하지 않습니다. 신호 화살표 알림을 받으면 구매 또는 판매하기만 하면 됩니다. 구매 후 비공개 VIP 그룹에 추가되도록 저에게 메시지를 보내주세요! (전체 제품 구매만 해당). 최신 최적화된 세트 파일을 구입한 후 저에게 메시지를 보내주세요. MT5 버전은   여기에서 사용할 수 있습니다. 여기에서   Beast Super Signal EA를 받으세요. 최신 결과를 보려면 댓글 섹션을 확인하세요! Beast Super Signal은 1:1, 1:2
Elliott Wave Trend MT4
Young Ho Seo
4 (7)
Elliott Wave Trend was designed for the scientific wave counting. This tool focuses to get rid of the vagueness of the classic Elliott Wave Counting using the guideline from the template and pattern approach. In doing so, firstly Elliott Wave Trend offers the template for your wave counting. Secondly, it offers Wave Structural Score to assist to identify accurate wave formation. It offers both impulse wave Structural Score and corrective wave Structure Score. Structural Score is the rating to sh
Smart Price Action Concepts
Issam Kassas
4.75 (12)
우선적으로, 이 거래 도구는 전문적인 거래에 이상적인 비-다시 그리기 및 지연되지 않는 지표입니다.  온라인 강좌, 사용자 매뉴얼 및 데모. 스마트 가격 액션 컨셉트 인디케이터는 신규 및 경험 많은 트레이더 모두에게 매우 강력한 도구입니다. Inner Circle Trader Analysis 및 Smart Money Concepts Trading Strategies와 같은 고급 거래 아이디어를 결합하여 20가지 이상의 유용한 지표를 하나로 결합합니다. 이 인디케이터는 스마트 머니 컨셉트에 중점을 두어 대형 기관의 거래 방식을 제공하고 이동을 예측하는 데 도움을 줍니다.  특히 유동성 분석에 뛰어나 기관이 어떻게 거래하는지 이해하는 데 도움을 줍니다. 시장 트렌드를 예측하고 가격 변동을 신중하게 분석하는 데 탁월합니다. 귀하의 거래를 기관 전략에 맞추어 시장의 동향에 대해 더 정확한 예측을 할 수 있습니다. 이 인디케이터는 시장 구조를 분석하고 중요한 주문 블록을 식별하고 다양한
Supply and Demand Dashboard PRO
Bernhard Schweigert
4.8 (20)
현재 20% 할인! 이 대시보드는 여러 기호와 최대 9개의 타임프레임에서 작동하는 매우 강력한 소프트웨어입니다. 주요 지표(최상의 리뷰: 고급 공급 수요)를 기반으로 합니다.   Advanced Supply Demand 대시보드는 훌륭한 개요를 제공합니다. 다음과 같이 표시됩니다.  영역 강도 등급을 포함하여 필터링된 공급 및 수요 값, 영역에 대한/및 영역 내 Pips 거리, 중첩된 영역을 강조 표시하고 모든 (9) 시간 프레임에서 선택한 기호에 대해 4가지 종류의 경고를 제공합니다. 그것은 당신의 개인적인 필요에 맞게 고도로 구성 가능합니다! 당신의 혜택! 모든 트레이더에게 가장 중요한 질문: 시장에 진입하기에 가장 좋은 수준은 무엇입니까? 최고의 성공 기회와 위험/보상을 얻으려면 강력한 공급/수요 영역 내 또는 그 근처에서 거래를 시작하십시오. 손절매를 위한 최적의 장소는 어디입니까? 가장 안전하려면 강력한 수요/공급 구역 아래/위에 정류장을 두십시오.
Rtc ML Ai Predictor MT4
Muhammad Faisal Sagala
Product Description Rtc ML Ai Predictor — Futuristic Intelligence for Real-Time Market Decisions Bring robotic precision to your trading.   Rtc ML Ai Predictor   fuses   Machine Learning   with   SMA-shift dynamics   to forecast short-term momentum and trend inflection points with clarity. The model evaluates multi-factor market structure, assigns a   confidence score   to each signal, and lets you act only when conditions align with your rules. Why traders choose Rtc ML Ai Predictor AI-guided e
ECM Elite Channel is a volatility-based indicator, developed with a specific time algorithm, which consists of finding possible corrections in the market. This indicator shows two outer lines, an inner line (retracement line) and an arrow sign, where the channel theory is to help identify overbought and oversold conditions in the market. The market price will generally fall between the boundaries of the channel. If prices touch or move outside the channel, it's a trading opportunity. The ind
Introduction to Fractal Pattern Scanner Fractal Indicator refers to the technical indicator that makes use of the fractal geometry found in the financial market. Fractal Pattern Scanner is the advanced Fractal Indicator that brings the latest trading technology after the extensive research and development work in the fractal geometry in the financial market. The most important feature in Fractal Pattern Scanner is the ability to measure the turning point probability as well as the trend probabi
GoldRush Trend Arrow Signal
Kirk Lee Holloway
5 (2)
GoldRush 트렌드 화살표 신호 GoldRush 트렌드 화살표 신호 지표는 XAU/USD 시장에서 고속 단기 스캘핑 트레이더를 위해 설계된 정밀한 실시간 트렌드 분석을 제공합니다. 1분 시간대에 특화되어 설계된 이 도구는 명확한 진입점을 표시하는 방향성 화살표를 제공하여 스캘퍼들이 변동성이 높은 시장 환경에서도 자신 있게 거래할 수 있도록 합니다. 이 지표는 PRIMARY 및 SECONDARY 경고 화살표로 구성됩니다. PRIMARY 신호는 추세 방향의 변화를 나타내는 흰색과 검은색 방향성 화살표이며, SECONDARY 신호는 PRIMARY 화살표가 지시하는 방향을 확인하고 잠재적인 거래 진입점을 표시하는 파란색과 빨간색 화살표입니다. 참고: 추세 방향이 변경된 후 PRIMARY 경고 화살표가 단 하나만 표시될 경우, 다수의 SECONDARY 파란색/빨간색 화살표가 표시될 수 있음을 유의해야 합니다. SECONDARY 신호는 신호 기준을 충족하는 어떤 캔들 이후에도 표시
ATC AlgoZone Indicator
Ameur Boudenne
5 (2)
Algo Trading Indicaor  With this indicator , you’ll have zones and trends that hight probability the price will reverse from it. so will gives you all the help that you need  Why should you join us !?  1-This indicator is logical since it’s working in previous days movement , to predict the future movements. 2-Algo trading indicator will help you to draw trends which is special and are too strong than the basics trend , trends will change with the frame time that you work on . 3-We can use
궁극의 화살표 지표 - 트레이딩 성공을 위한 당신의 도구! 많은 것을 약속하지만 제공하는 것이 적은 도구에 지치셨나요? 우리의 Ultimate Arrow Indicator for MT4는 당신의 트레이딩을 한 단계 높은 수준으로 끌어올릴 궁극적인 솔루션입니다. 이 지표는 명확하고 신뢰할 수 있는, 타협 없는 신호를 제공하기 위해 정밀하게 설계되었습니다. 이렇기 때문에 Ultimate Arrow Indicator는 경험이 풍부한 트레이더와 초보자 모두에게 이상적인 선택입니다: 탁월한 성능 - 검증된 결과 1년간의 상세한 백테스트: 승률 90%로 이 지표는 수익을 창출하는 데 매우 신뢰할 수 있는 것으로 입증되었습니다. 7,006개의 생성된 신호 중 6,242개가 승리였으며, 신호당 평균 29핍의 이익을 얻었습니다. 손실 비율 최소화: 생성된 신호 중 10%만이 부정적인 결과였으며, 이는 알고리즘의 정확도와 품질을 증명합니다. 주요 기능 리페인트 없음 : 신호가 생성된 후에는 변경되지
Supreme Commander
Ramon Sobrevals Arce
4.13 (8)
The indicator of the indicators. The Most Powerful Technique to Determine Forex Trend Strength in 2023. We have perfected Supreme Commander that it calculates an average of the selected indicators (up to 16) and the selected timeframe (all) with the result of a single trend that indicates the potential of buying and selling.  It includes the following indicators: Accelerator/Decelerator oscillator Average Directional Movement Index Awesome oscillator; Bulls and Bears  Commodity Channel Index; De
BinaryUniversal
Andrey Spiridonov
BinaryUniversal is a signal indicator for binary options and Forex. In its work, the indicator uses a complex algorithm for generating signals. Before forming a signal, the indicator analyzes volatility, candlestick patterns, important support and resistance levels. The indicator has the ability to adjust the accuracy of the signals, which makes it possible to apply this indicator for both aggressive and conservative trading. The indicator is set in the usual way, it works on any time period and
Introduction to X3 Chart Pattern Scanner X3 Cherart Pattern Scanner is the non-repainting and non-lagging indicator detecting X3 chart patterns including Harmonic pattern, Elliott Wave pattern, X3 patterns, and Japanese Candlestick patterns. Historical patterns match with signal patterns. Hence, you can readily develop the solid trading strategy in your chart. More importantly, this superb pattern scanner can detect the optimal pattern of its kind. In addition, you can switch on and off individu
"Dragon's Tail" is an integrated trading system, not just an indicator. This system analyzes each candle on a minute-by-minute basis, which is particularly effective in high market volatility conditions. The "Dragon's Tail" system identifies key market moments referred to as "bull and bear battles". Based on these "battles", the system gives trade direction recommendations. In the case of an arrow appearing on the chart, this signals the possibility of opening two trades in the indicated directi
Scientific trade
Aleksey Ivanov
5 (1)
An extremely convenient indicator that truly makes the process of making money on the exchange easy. It is based on the scientifically rigorous theory of the market developed by the author, the beginning of which is presented here .                The full algorithm of this indicator operation is presented in the article .               The indicator calculates the most probable price movement trajectory and displays it on the chart. Based on the predicted price movement trajectory
Super Signal – Skyblade Edition 전문가용 노리페인트 / 노래그 트렌드 신호 시스템, 뛰어난 승률 제공 | MT4 / MT5용 핵심 기능: Super Signal – Skyblade Edition은 추세 매매를 위해 설계된 스마트 신호 시스템입니다. 이 시스템은 다중 필터 로직을 활용하여, 명확한 방향성과 실질적인 모멘텀이 수반된 고품질 추세만을 감지합니다. 이 시스템은 고점 또는 저점을 예측하지 않으며 , 다음 세 가지 조건이 모두 충족될 때만 신호를 발생시킵니다: 명확한 추세 방향 강화되는 모멘텀 건전한 변동성 구조 또한, 시장 세션 기반의 유동성 분석을 통해 신호의 신뢰성과 타이밍을 더욱 향상시킵니다. 신호 특성: 모든 화살표 신호는 100% 리페인트 없음 / 지연 없음 신호가 한 번 발생하면 고정되며, 깜빡이거나 사라지지 않음 차트 상의 시각적 화살표, 정보 패널, 팝업 알림, 사운드 알림, 푸시 알림 포함 EA 통합 가능 (버퍼 출력 제공), 자동
Hit Rate Top Bottom Signal
Martin Alejandro Bamonte
히트율 탑 바텀 신호 히트율 탑 바텀 신호 히트율 탑 바텀 신호 는 완전히 혁신적인 접근 방식을 제공합니다. 특정 TP-SL과 PAIR/TF에서 어떤 성과를 내는지 미리 평가하고자 하는 분들께 이상적입니다. 전략 히트율 탑 바텀 신호 는 모든 트레이더와 모든 거래 유형 에게 필수적인 도구입니다. 이 전략은 정확한 리페인트 없는 신호 를 제공하여 언제 어떤 방향으로 거래해야 할지를 명확하게 제시할 뿐만 아니라 각 페어와 TF에 대한 상세한 성공률 기록 을 제공합니다. 사전 정의된 테이크 프로핏(TP)과 스톱 로스(SL)을 통해 신호의 효율성을 미리 알 수 있습니다 , 이는 효과적인 리스크 관리와 정확한 거래에 매우 중요합니다. 이 전략의 특징은 전체 움직임이 아닌 임펄스 내의 반전 지점을 감지하는 데 중점을 두고 있어 전통적인 탑-바텀보다 신호 발생 빈도가 높고, 시장의 주요 변동에서 핵심 순간을 포착하는 데 집중합니다. 이 전략은 SL/TP 비율과 결합된 신호의 과거 성과를
제작자의 제품 더 보기
FX Mutant Cougar
Stefanus Nigel
You have to wait the background colors, if the background's RED, you have to wait the yellow arrows to take selling orders. If the background's BLUE, you have to wait the white arrows to take buying orders. When the arrows show out, please wait for the close candles, otherwise it repaints. Please you watch the background colors, if the background's Lighter Red, that means big downtrend signals, if it's Darker Red, you have to be carefull. Because the downtrend can change to uptrend suddenly. if
필터:
리뷰 없음
리뷰 답변