Market Impulse
- Indicadores
- Versión: 2.0
- Actualizado: 13 noviembre 2018
- Activaciones: 5

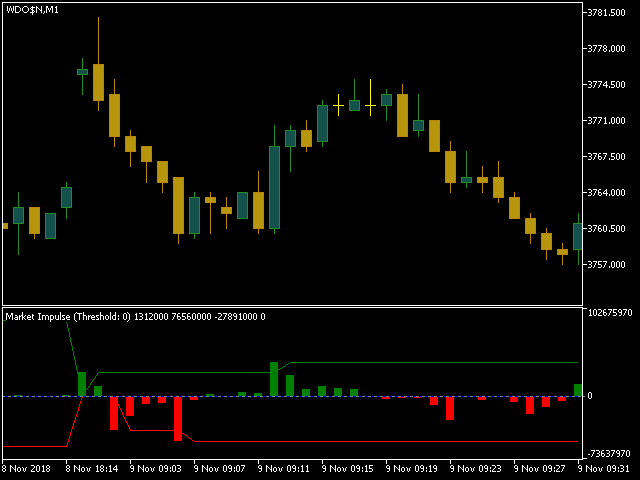
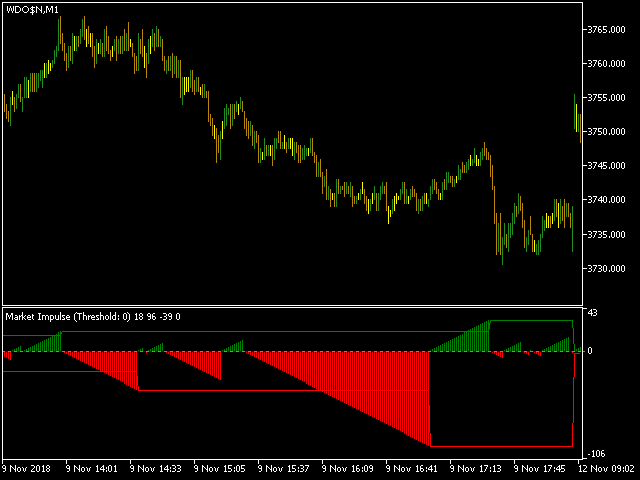
Este indicador utiliza información de volumen y volatilidad para indicar la tendencia o para indicar la reversión/corrección del mercado. Son 2 indicadores en uno. El indicador funciona en dos estilos: valores por vela y valores acumulados.
Utilizando la información de volumen y volatilidad, cuando está bien ajustado, este indicador tiene una buena probabilidad de indicar la dirección correcta, tanto en plazos inferiores (M1, M2, M5) como superiores (M15, M30).
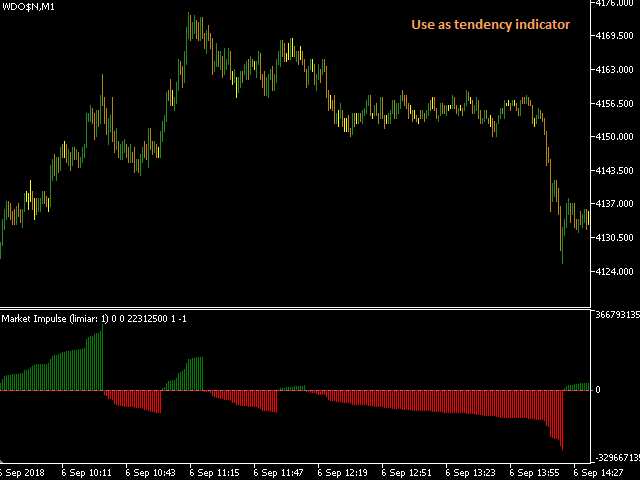
Estrategia 1: Indicador de tendencia
Indica la dirección de la operación. Para utilizarlo como indicador de tendencia, siga estos pasos:
- Elige el símbolo y el marco temporal deseado
- Añade el indicador y configura los parámetros:
- "Acumular valores": "Sí"
- "Acumular umbral de giro": cero
- "Actualizar umbral al romperse": "No"
- "Tipo de acumulación": "Normal"
- Compruebe si puede identificar fácilmente las tendencias. En caso contrario, aumente gradualmente el "Umbral de volteo de la acumulación" hasta que esté bien.
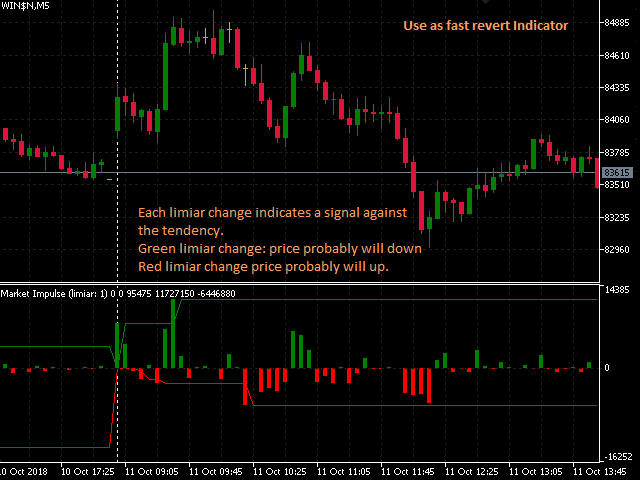
Estrategia 2: reversión/corrección rápida del mercado
Indica el momento en que probablemente se producirá una corrección o reversión del mercado. Utilícelo en operaciones rápidas. Para utilizarlo como indicador, siga estos pasos:
- Elige el símbolo y el marco temporal deseado
- Añade el indicador y configura los parámetros:
- "Acumular valores": "No"
- "Acumular umbral de giro": cero
- "Actualizar umbral al romperse": "Sí"
Siempre que la línea de umbral negativa (rojo: Limiar -) o positiva (verde: Limiar +) aumente, probablemente el precio girará en la dirección (o por una reversión o por una corrección). Por ejemplo: Si el umbral positivo aumenta, debería ser un buen momento para vender y cerrar esta posición algunas velas por delante.
Los otros parámetros sirven para permitir un ajuste más fino para ambas estrategias.
Parámetros:
- Volúmenes: El tipo de volumen.
- Tick (0): volumen tick
- Real (1): volumen real
- Aplicado a: Que params vela para utilizar a la volatilidad.
- HILO (0)
- Apertura y cierre (1)
- Apertura (2)
- Cierre (3)
- OHLC (4)
- Actualizar umbral cuando se rompe: ¿Se modificará el umbral cuando la barra suba el valor?
- No (1)
- Sí (2)
- Umbral mínimo: Umbral mínimo para empezar
- Acumular valores: Alternar para acumular valores consecutivos de volatilidad en la misma dirección.
- No (1)
- Sí (2)
- Tipo de acumulación: Sólo se utiliza cuando Acumular valores está activado.
- Normal: Utiliza una variación relativa de la vela
- Discreto: Utiliza un incremento fijo
- Señal: Muestra sólo la señal de operación
- Umbral de volatilidad de la acumulación: Valor máximo de volatilidad que tolera el indicador para poner una volatilidad inversa en la acumulación actual. Sólo se utiliza cuando "Acumular valores" está en "Sí".
- Mostrar línea de saldo: Sólo funciona cuando el tipo de acumulación es Normal.
- Acumular valores de línea de saldo:
- No (1)
- Sí (2)
- Mostrar marcadores de tiempo: Traza una línea vertical cada vez que se eleva el umbral. Por razones de rendimiento, esta función sólo funciona en el día actual (los días anteriores nunca trazarán las líneas).
Programadores: Este indicador ha sido optimizado para su uso con asesores expertos, ¡no se redibuja! EA debe esperar a que la vela se cierre. No actúe sobre velas incompletas (de lo contrario el EA puede actuar sobre una señal falsa).