Pressure Book
- Indicadores
- Versión: 1.0
- Activaciones: 5
Averigüe en tiempo real qué lado, comprador o vendedor, está ejerciendo más presión mediante una sencilla y eficaz visualización de la Profundidad de Mercado. El indicador calcula la cantidad de ofertas a las profundidades especificadas y muestra el porcentaje de cada lado en relación con el total.
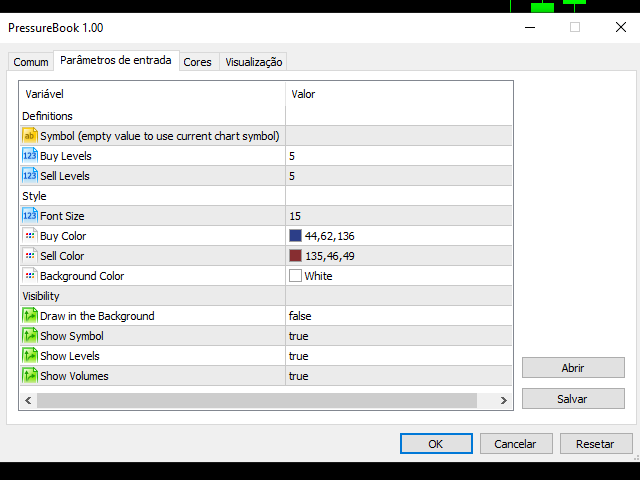
El indicador PressureBook es totalmente personalizable, en el que puede:
- Seleccionar qué símbolo desea seguir. Por defecto, el símbolo seleccionado es el mismo que el gráfico en el que se insertó el indicador;
- Definir la cantidad de niveles de precios utilizados para calcular la presión en cada lado;
- Elegir colores y tamaño de letra;
- Ver en modo de fondo;
- Cambiar el tamaño;
- Desplazarse a cualquier lugar de la pantalla;
- Seleccionar la información que debe mostrarse.