VWAP Bands
- Indicadores
- Versión: 1.2
- Actualizado: 11 diciembre 2018
- Activaciones: 5

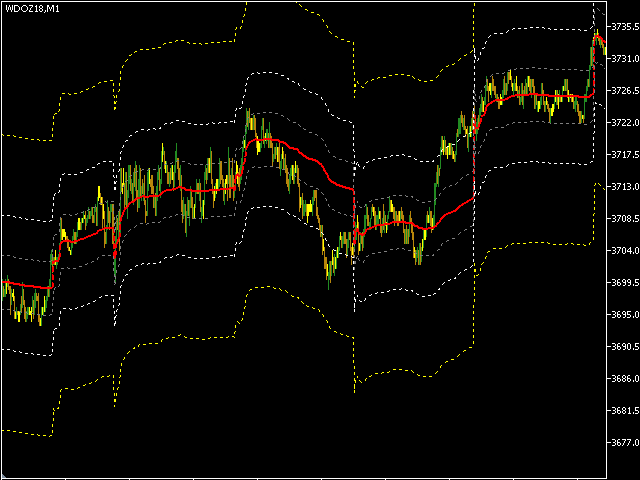
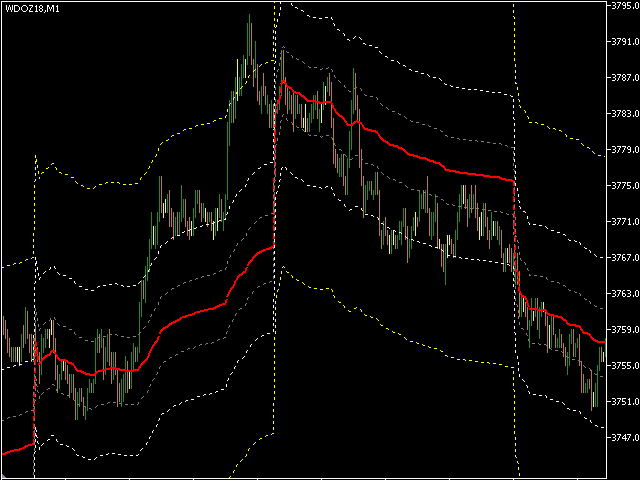
Este indicador utiliza el VWAP y lo proyecta en hasta 3 niveles, desplazados por un porcentaje del símbolo del gráfico.
Cómo configurarlo:
- Elija el símbolo y la hora deseada del gráfico
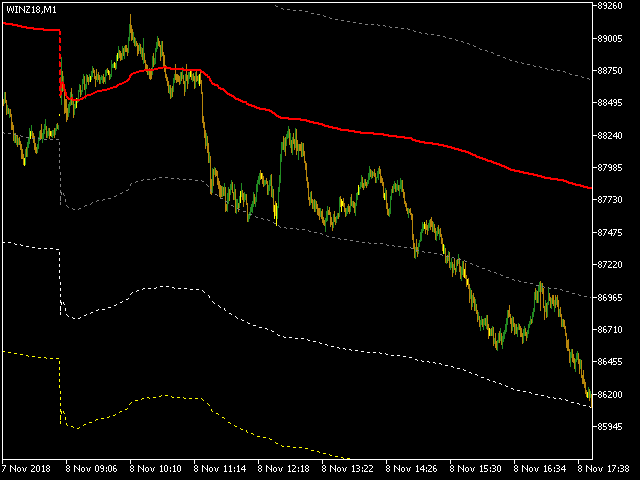
- Establezca la hora de inicio del símbolo (en bovespa, WIN y WDO comienzan a las 9 en punto). Esta hora se utiliza como referencia de corte para el VWAP.
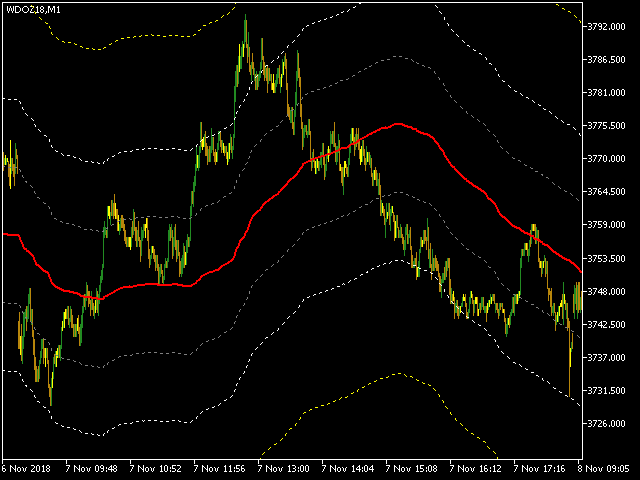
- Compruebe qué periodo VWAP se ajusta mejor al gráfico: Lo ideal es un periodo en el que el VWAP no esté muy alejado del gráfico.
- Establezca niveles porcentuales: Lo ideal es establecer niveles basados en el histórico, de forma que el nivel 1 toque la mayoría de los picos cortos, el nivel 2 toque la mayoría de los picos largos y el nivel 3 toque la mayoría de los picos (valores atípicos).
Los demás parámetros sirven para permitir un ajuste más fino.
Parámetros:
- VWAP Tipo:
- Diario (0)
- Semanal (1)
- Mensual (2)
- Periodo (3): Se trata de un VWAP móvil basado en el periodo indicado por el campo Periodo VWAP.
- Cada hora (4): El VWAP se reinicia cada hora
- Cada 2 horas (5): El VWAP se reinicia cada 2 horas
- Cada 3 horas (6): El VWAP se reinicia cada 3 horas
- Cada 4 horas (7): El VWAP se reinicia cada 4 horas
- Cada 6 horas (8): El VWAP se reinicia cada 6 horas
- [Tipo:Periodo] Periodo VWAP: Sólo se utiliza cuando el Tipo de VWAP es Periodo.
- Hora inicial: Hora de referencia VWAP. Establezca la hora de apertura del símbolo en el día. Si es un símbolo que trabaja 24hrs, coloque una hora preferida por usted (normalmente la hora de apertura de NY o de algún otro mercado bursátil significativo).
- Se aplica a:
- Apertura (0)
- Cierre (1)
- Máximo (2)
- Mínimo (3)
- Apertura y cierre (4)
- HILO (5)
- Cierre, alta y baja (6)
- Apertura, cierre, alta y baja (7)
- Porcentaje de banda 1: Establece el nivel de banda 1. El valor está en porcentaje del cierre del día anterior del símbolo actual. Por ejemplo: Si el símbolo cerró ayer a 5000 puntos, poniendo el valor 1% en la banda 1 dibujará la banda 1 desplazada 50 puntos del VWAP, arriba y abajo.
- Porcentaje de la banda 2: Establece el nivel de la banda 2. El valor está en porcentaje del cierre del día anterior del símbolo actual. Por ejemplo: Si el símbolo cerró ayer a 5000 puntos, poniendo el valor 1% en la banda 2 dibujará la banda 2 offset 50 puntos del VWAP, al alza y a la baja.
- Porcentaje de la banda 3: Establece el nivel de la banda 3. El valor está en porcentaje del cierre del día anterior del símbolo actual. Por ejemplo: Si el símbolo cerró ayer a 5000 puntos, poniendo el valor 1% en la banda 3 dibujará el offset de la banda 3 50 puntos del VWAP, al alza y a la baja.
- Porcentaje de la banda 4: Establece el nivel de la banda 4. El valor está en porcentaje del cierre del día anterior del símbolo actual. Por ejemplo: Si el símbolo cerró ayer a 5000 puntos, poniendo el valor 1% en la banda 4 dibujará el offset de la banda 4 50 puntos del VWAP, al alza y a la baja.
- Porcentaje de la banda 5: Establece el nivel de la banda 5. El valor está en porcentaje del cierre del día anterior del símbolo actual. Por ejemplo: Si el símbolo cerró ayer a 5000 puntos, poniendo el valor 1% en banda 5 dibujará la banda 5 desplazada 50 puntos del VWAP, arriba y abajo.
Programadores: Este indicador ha sido optimizado para su uso en robots (Expert Advisor), ¡no se redibuja! EA debe esperar a que la vela se cierre. No actúe sobre velas incompletas (de lo contrario el robot puede actuar sobre una falsa alarma).