Right Signals MT4
- Indicadores
- Versión: 3.8
- Actualizado: 23 mayo 2020
- Activaciones: 5

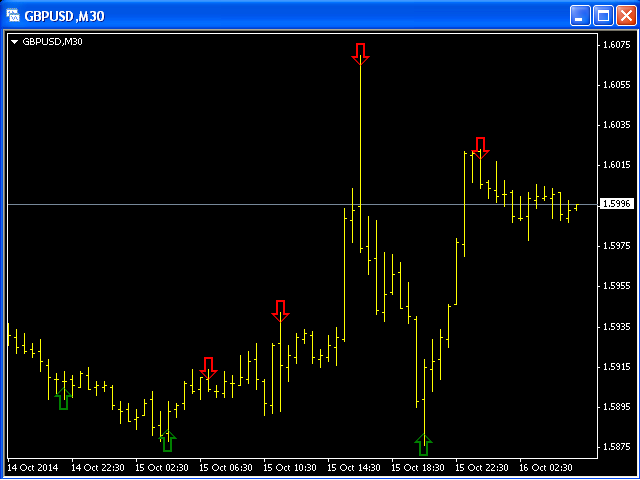
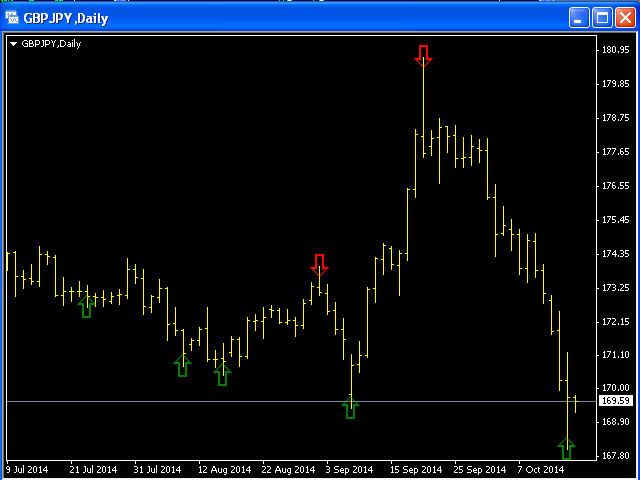
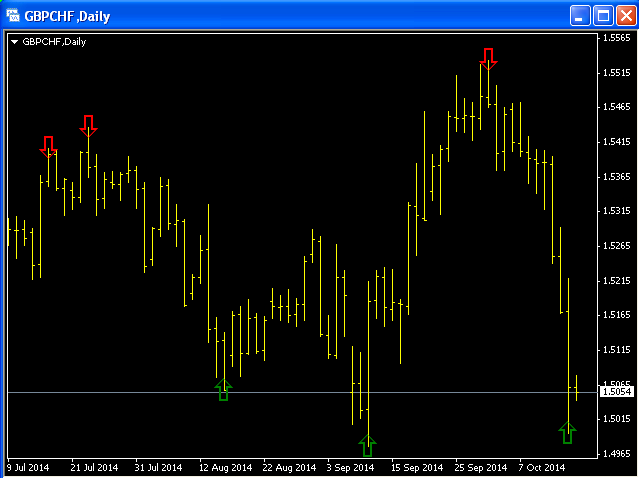
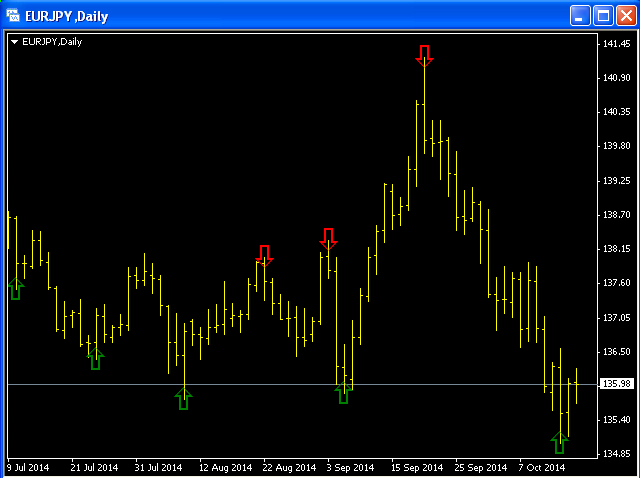
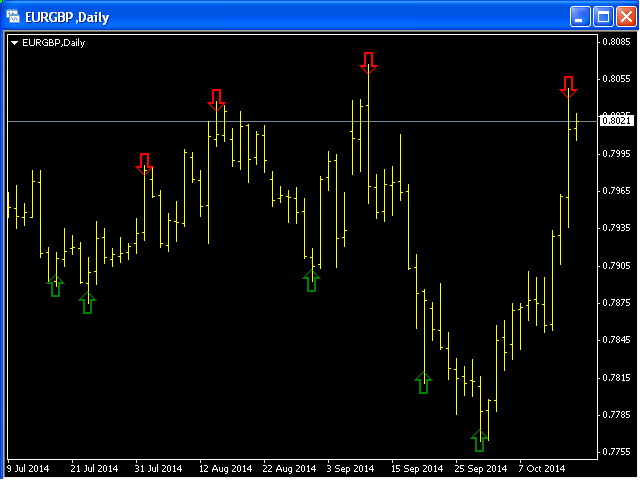
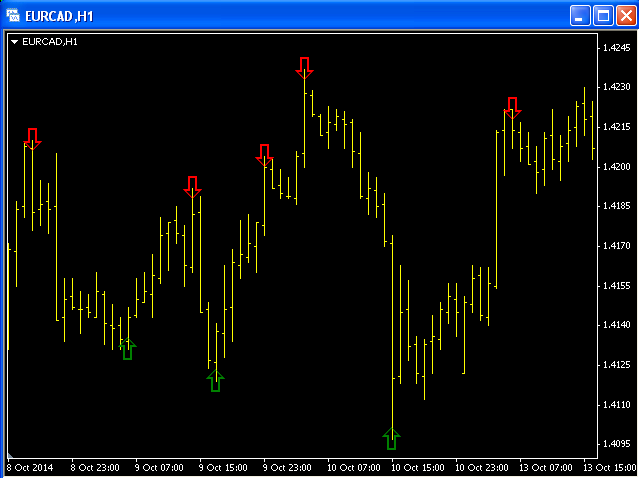
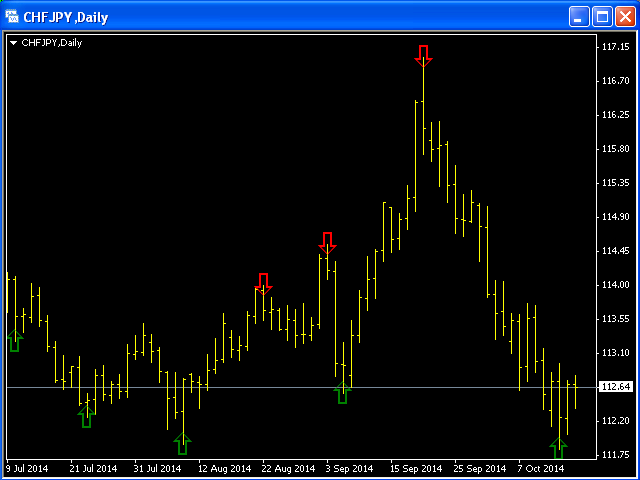
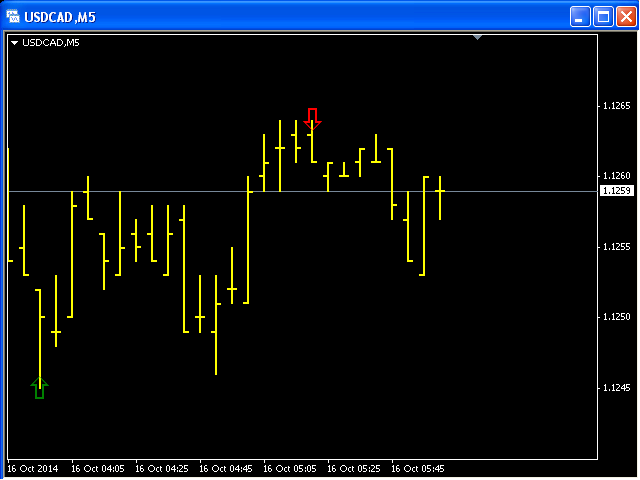
Este indicador simplificará su vida comercial. El indicador no tiene parámetros de entrada.
- Lasflechas rojas indican el comienzo de la tendencia bajista y será un buen momento para abrir una posición corta.
- Lasflechas verdes indican el comienzo de una tendencia alcista y será un buen momento para abrir una posición larga.