Trend histogram Mefistofel
- Indicadores
- Versión: 2.2
- Actualizado: 16 abril 2021

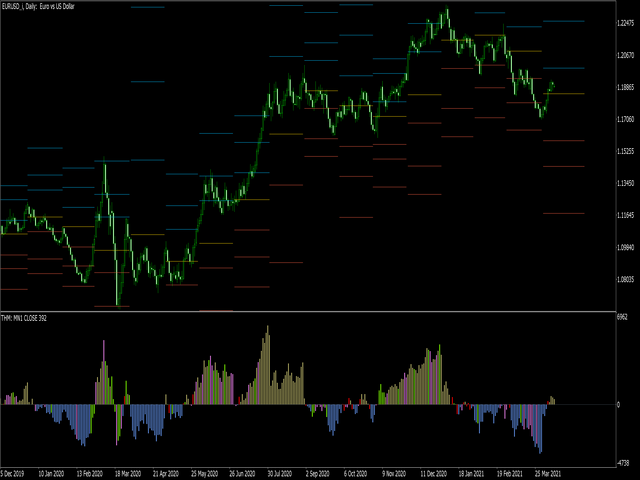
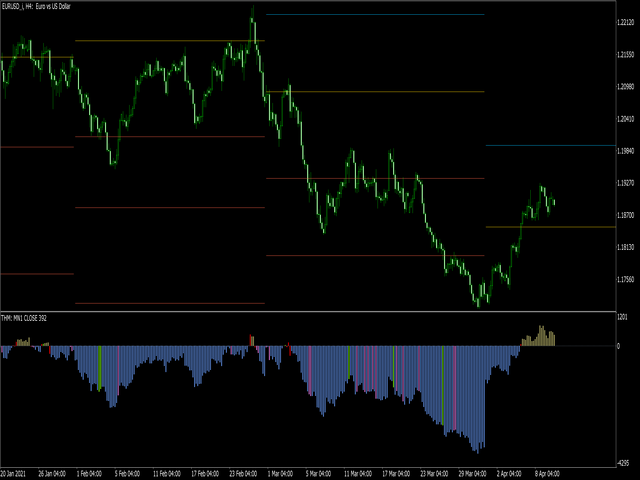
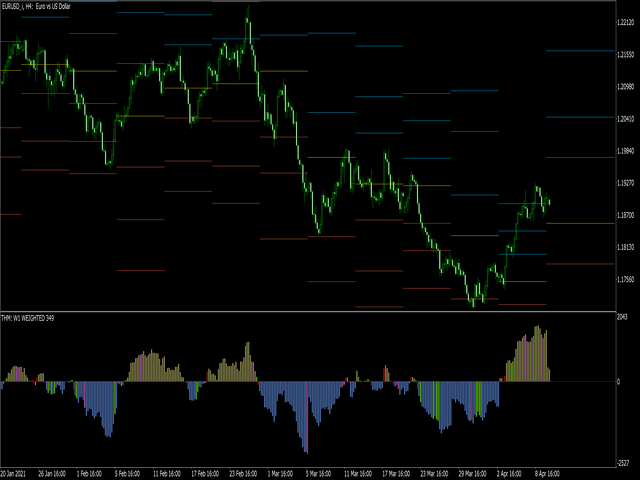
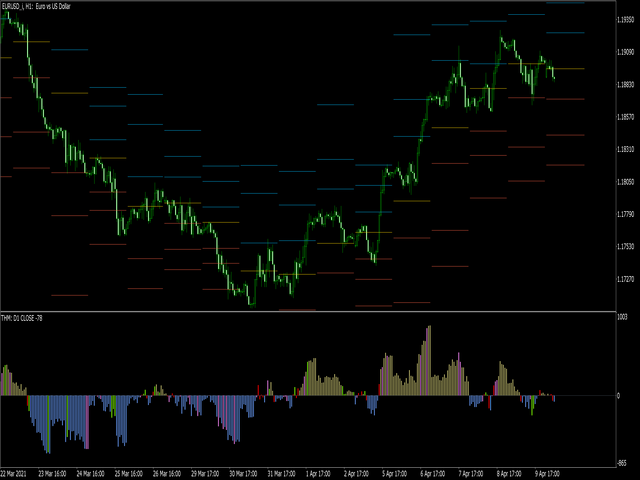
Calcula los niveles pivote.
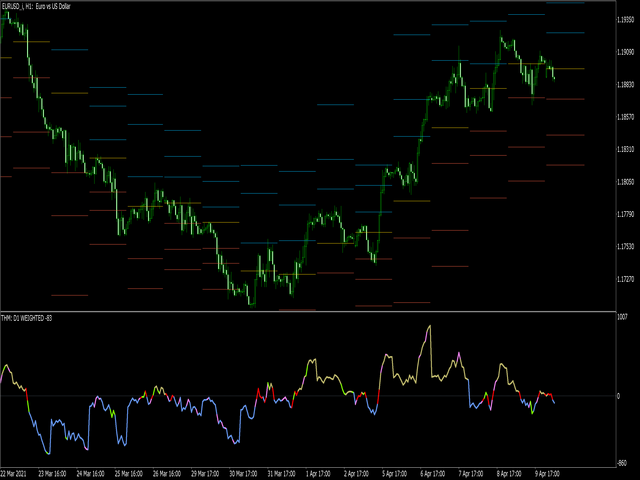
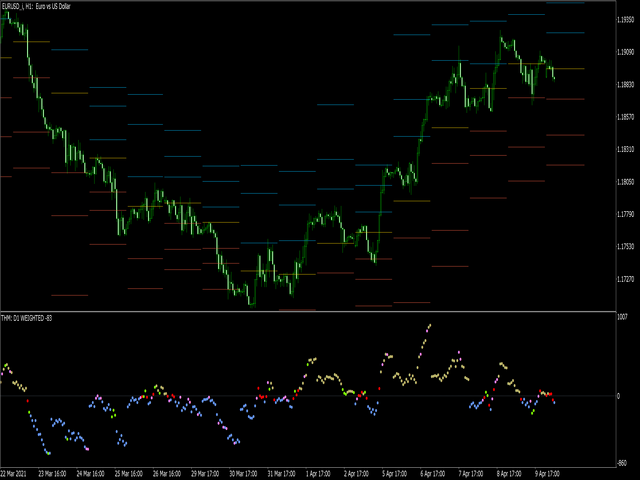
Pinta el histograma en función de la ubicación de los precios respecto a estos niveles.
Valores de los parámetros:
- estilo - selecciona el tipo de visualización (Histograma, Línea, Flecha)
- price - precio, tiene poco efecto en el aspecto final, pero se puede personalizar
- marco temporal - seleccione un marco temporal para calcular los niveles.
- color over pivot line - color de todo lo que está por encima del nivel de pivote
- color por debajo de la línea pivote - color de todo lo que está por debajo del nivel pivote
- colorde intersección de línea pivote - el color cuando el cuerpo de la vela cruza la línea central
- color of resistance level breakout - color cuando la sombra superior de la vela cruza cualquier nivel
- colorde ruptura de nivel de soporte - el color cuando la sombra inferior de la vela cruza cualquier nivel
- color de intersección de dos líneas - el color cuando dos sombras cruzan niveles
- aumentar el resultado con volúmenes de ticks - multiplica el resultado del cálculo por el número de ticks de la vela
Una selección de opciones de nivel.
- MN1
- W1
- D1
- H12
- H8
- H6
- H4
- H3
- H2
- H1
Si el valor del indicador está cerca de 0, entonces el precio se ha acercado al nivel potencial de reversión o rebote.
Fórmulas:
Pivot = (high + close + low) / 3
R1 = (2 * Pivot) - low
S1 = (2 * Pivot) - high
R2 = Pivot + (R1 -S1)
R3 = high + (2 * (Pivot - low))
S2 = Pivot - (R1 - S1)
S3 = low - (2 * (high - Pivot))
Las líneas horizontales en las capturas de pantalla de los gráficos se muestran para mayor claridad. Los valores del indicador se calculan a partir de estas líneas.
Para dibujar estas líneas, se utilizó esta utilidad: https: //www.mql5.com/en/market/product/63805

El usuario no ha dejado ningún comentario para su valoración