Anchored VWAP with no Volume
- Indicadores
-
Anton Polkovnikov
 MOEX intraday trader.
Developing scripts for MT5.
I'm on Telegram: @stockgambler
My Telegram group: https://t.me/stockgamblers - Versión: 1.0
- Activaciones: 5
VWAP anclado (sin volumen)
Un desarrollo único de uno de los indicadores VWAP más útiles. Este producto le permite prescindir del uso de los elementos básicos del VWAP, es decir, el volumen. Todo se calcula sin él. Además, se ha desarrollado un cómodo sistema de selección de puntos de inicio - moviendo el "campo de inicio" usted indica al script la zona, en la que se debe buscar el extremo, desde el que se iniciará el cálculo.
Las principales ventajas de este desarrollo
- cómodo sistema de selección del punto de inicio del cálculo de VWAP con una zona rectangular móvil movida con el ratón
- VWAP ahora se puede utilizar en mercados donde no hay datos de volumen disponibles - FOREX, Crypto
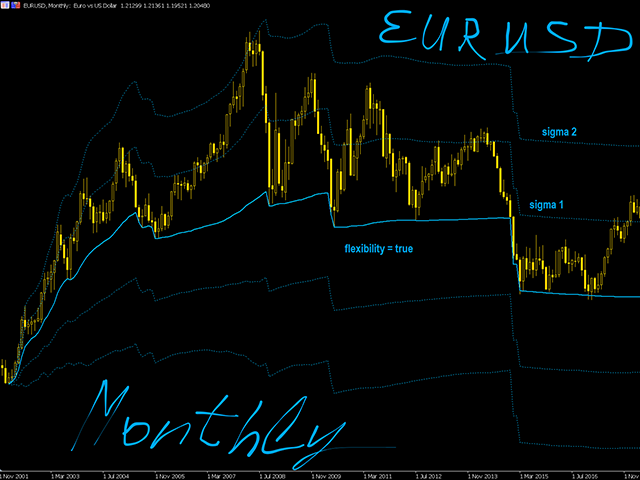
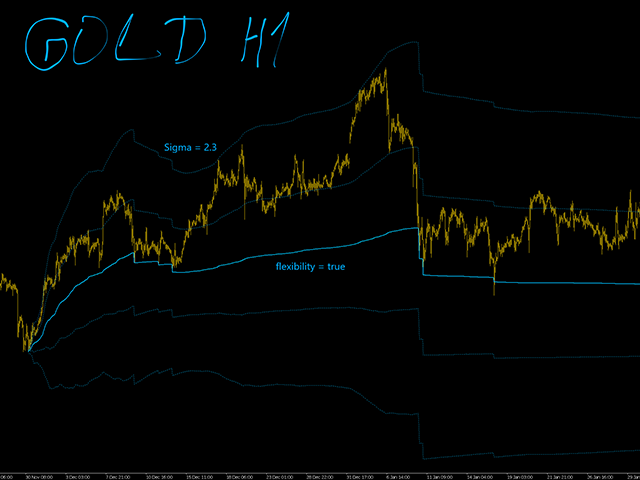
- disponibilidad de zonas de desviación estándar ajustables. Usted quiere 1,79 en lugar de sigma 2 - usted puede hacerlo
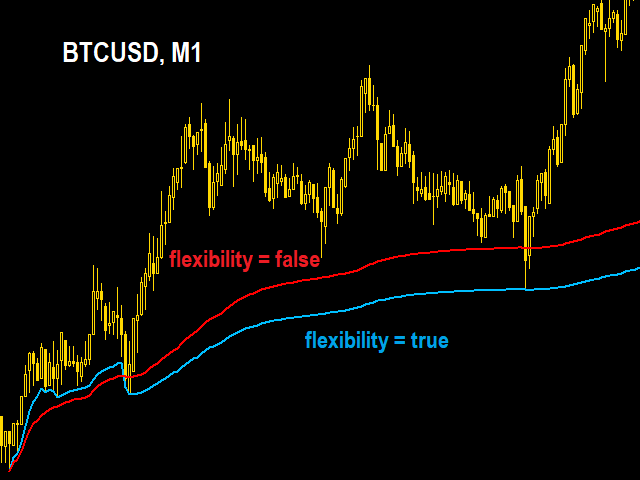
- Una modificación completamente única de VWAP es el parámetro "Flexibilidad". Compruébelo en las capturas de pantalla
- cálculo a partir de extremos, que hace que VWAP sea lo más preciso posible
Los parámetros de entrada del producto son elementales.
- número de indicador. Si desea colocar varios VWAP en el gráfico, cada uno debe tener su propio número.
- selección de color
- dimensiones del campo de control
- los precios que participarán en el cálculo. Existen medianas estándar y extremas, a las que recomiendo prestar especial atención
- Habilitar el parámetro "Flexibilidad
- Activar/desactivar el cálculo mediante volumen
- Habilitar/deshabilitar la visualización de sigma y ajustar manualmente sus valores