Trailing Stop Loss MT4
- Indicadores
- Versión: 4.8
- Actualizado: 23 mayo 2020
- Activaciones: 5

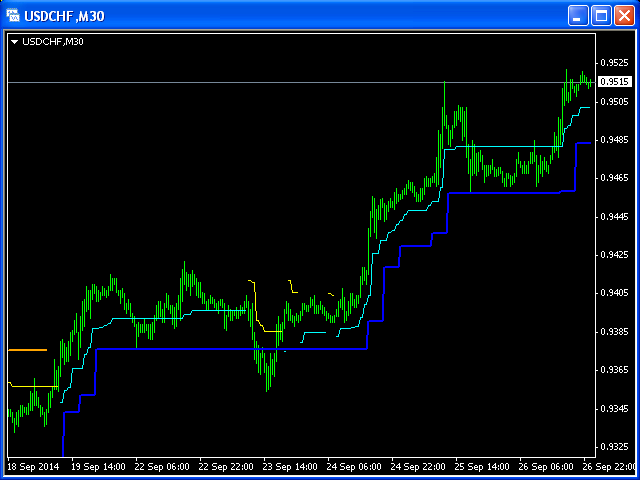
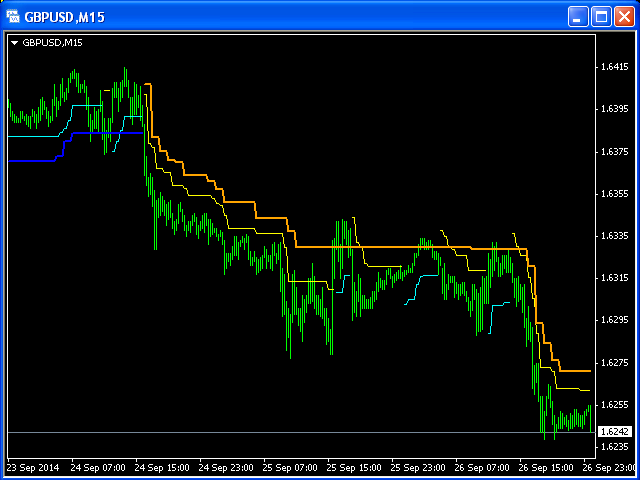
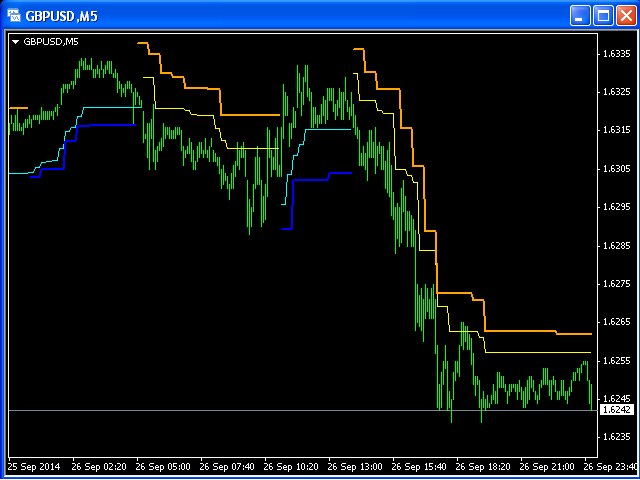
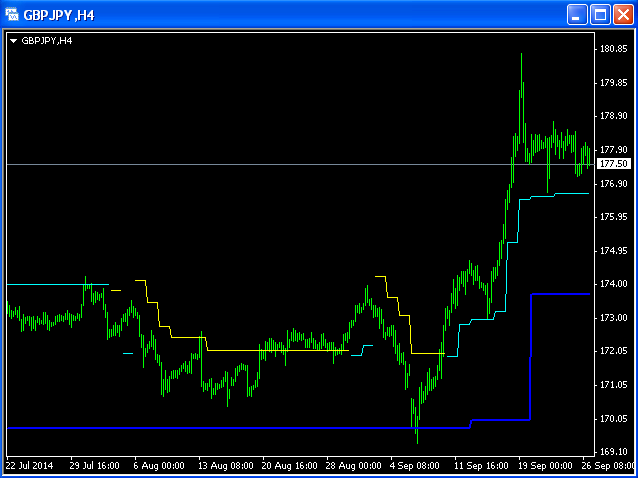
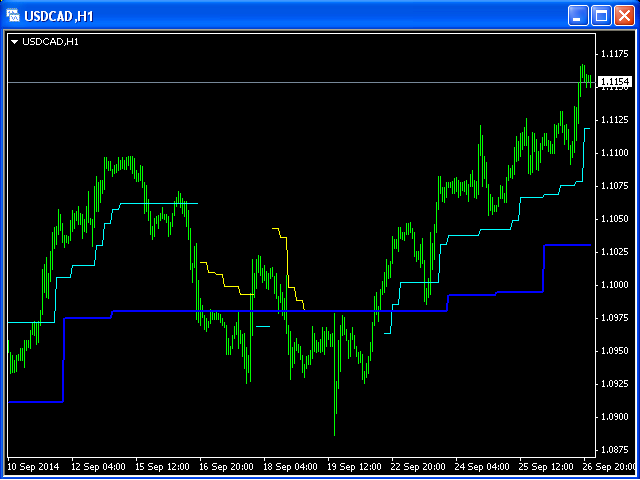
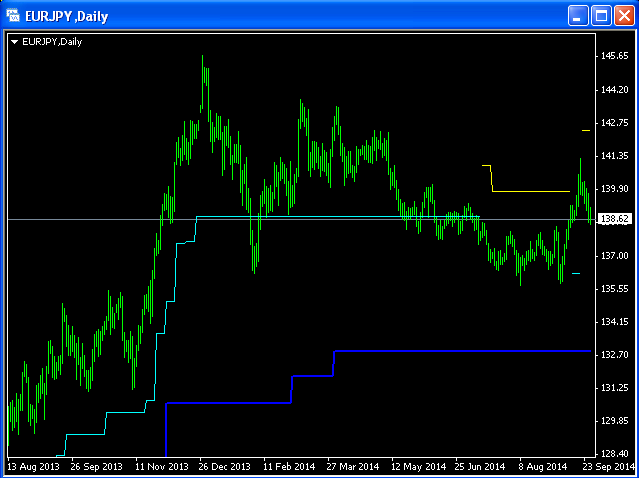
El objetivo principal de este indicador es mostrar 2 líneas de posibles valores de Trailing Stop Loss:
- Líneaamarilla/amarilla para Trailing Stop Loss más cercanos al precio actual.
- LíneaNaranja/Azul para un Trailing Stop Loss más arriesgado (pero más rentable).
Si la línea (parece una escalera) cambia los colores de Amarillo a Aqua (línea #1) y/o de Naranja a Azul (línea #2) en consecuencia esto significa que tenemos una situación cuando una tendencia cambió su curso al opuesto.
Por lo tanto, este indicador puede ser útil para abrir posiciones también.
3 parámetros de entrada: Period1 = 50; Period2 = 60; VisibleBars = 1000.
VisibleBars se encarga de calcular las líneas del Indicador desde la Barra actual hasta 1000 (o cualquier número lógico) Barras atrás.
Period1 y Period2 deben ser optimizados para cada par de divisas y TimeFrame para obtener el mejor resultado.