Fibo World MT5
- Indicadores
- Pavel Verveyko
- Versão: 1.1
- Ativações: 5
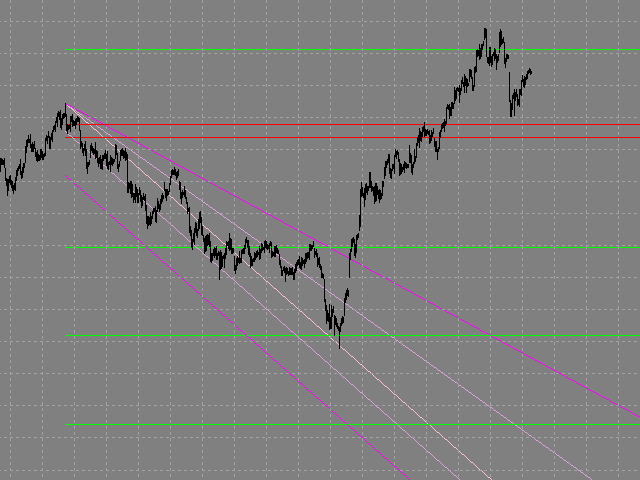
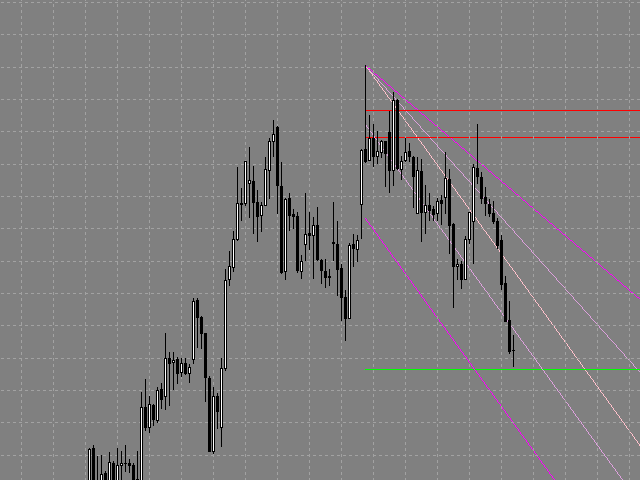
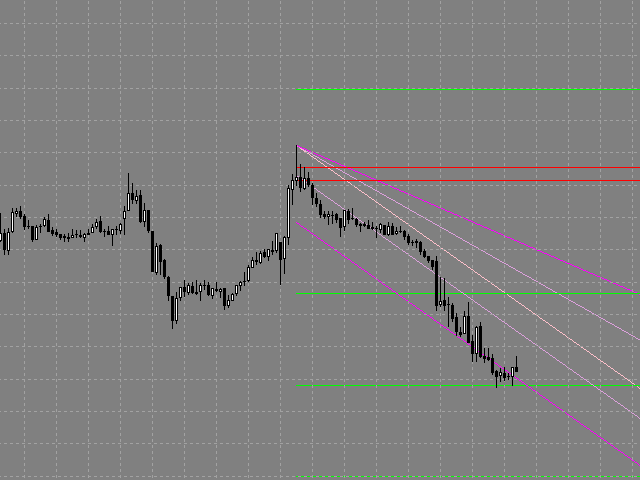
The indicator builds a graphical analysis based on the Fibonacci theory.
Fibo Fan is used for the analysis of the impulses and corrections of the movement.
Reversal lines (2 lines at the base of the Fibonacci fan) are used to analyze the direction of movements.
The indicator displays the of 4 the target line in each direction.
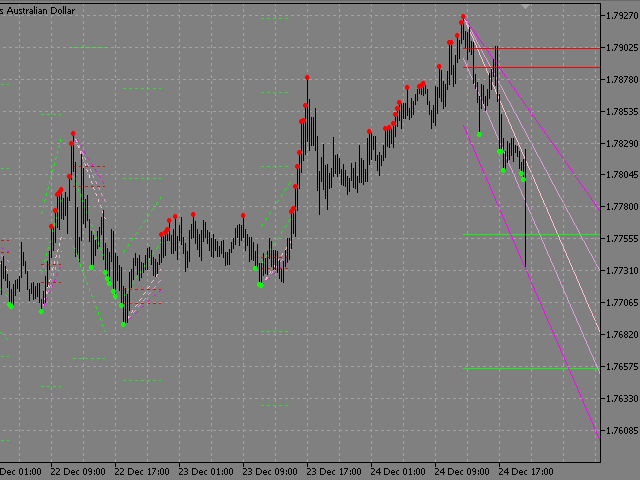
The indicator takes into account market volatility.
If the price is above the reversal lines, it makes sense to consider buying, if lower, then selling.
You can open positions after a breakout, rebound, or test on the reverse side of any reversal, target, or fan line.
When the market situation changes, the Fibo indicator changes direction.
Settings:
- Show_History_Size - the size of the displayed history.
- Fibo_Period - number of candles to build.
- Fibo_Size_min - minimum fibo fan size (in candles).
- Show_Last_Fibo -hide/display past Fibo builds.
- Show_Extremum - hide/show the extremum.
- Send_Sound - sound alert.
- Send_Mail - send an email notification.
- Send_Notification - send a mobile notification.
- Send_Alert - standard terminal alert.
- Here are the most important settings. You can also change the following characteristics: color, thickness, style.