Money Zones MT5
- Indicadores
- Versión: 12.300
- Activaciones: 5

Descripción
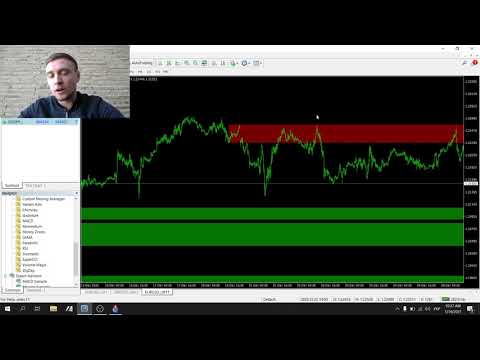
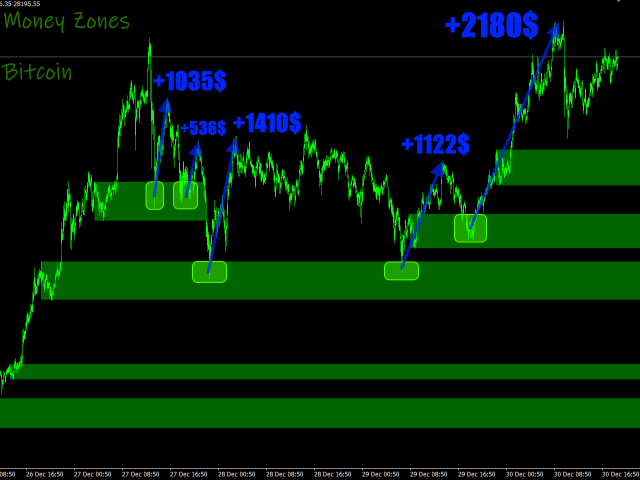
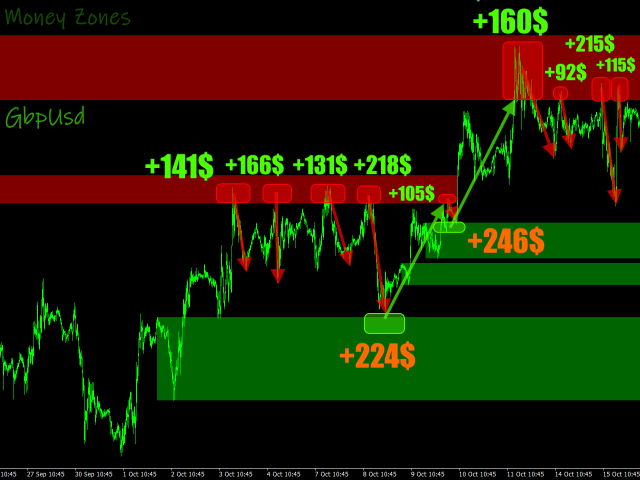
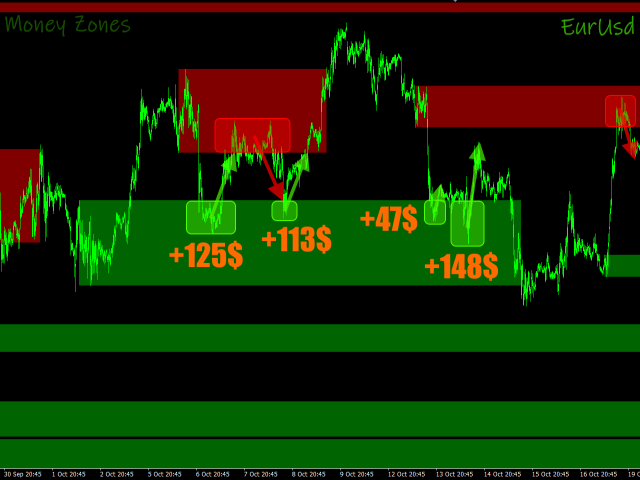
Money Zones es un indicador que determina zonas de acumulación/distribución en el mercado. Las zonas verdes permiten buscar puntos de entrada de compras o puntos de salida de ventas. Las zonas rojas, por el contrario, definen la oportunidad de vender o cerrar compras. El indicador tiene la capacidad de definir zonas monetarias para dos marcos temporales simultáneamente en el mismo gráfico.
¿Cómo utilizarlo?
Utilice este indicador para identificar zonas de mercado como zonas de soporte/resistencia para determinar las mejores condiciones para los puntos de entrada y salida del mercado.
Parámetros
_INDICATOR_SETTINGS_ - ajustes del indicador. Maximum History Bars - conteo máximo de barras históricas a calcular.
Average True Range Period - periodo del indicador ATR.
Fast Moving Period - periodo de la media móvil rápida.
Slow Moving Period - periodo de la media móvil lenta.
Movings Difference - diferencia mínima entre medias móviles.
Impulso de Refuerzo de Zonas - valor de impulso de refuerzo de zonas.
Zones Reinforce Type - tipo de refuerzo de zona.
ZonesReinforce Correction - valordecorrecciónde la zona derefuerzo.
ZonesBreak Correction - valor de corrección de la zona de ruptura.
ZonesReinforce Correction - valordecorrecciónde la zona derefuerzo.
ZonesBreak Correction - valor de corrección de la zona de ruptura.
_GRAPHICS_SETTINGS_ - ajustes gráficos.
Timeframe #1 - timeframe #1.
Timeframe #2 - timeframe #2.
TF1 Buy Zones Color - color de las zonas de compra del Timeframe #1.
TF1 Sell Zones Color - color de las zonas de venta del Timeframe #1.
TF2 Buy Zones Color - color de las zonas de compra del Timeframe #2.
TF2 Sell Zones Color - color de las zonas de venta del Timeframe #2.
_NOTIFICATIONS_SETTINGS_ - configuración de las notificaciones.
Alert Notification - permitir notificaciones de alerta.
Push Notification - permitir notificaciones push.
E-Mail Notification - permitir notificaciones por correo electrónico.