Volume Magic MT5
- Indicadores
- Versión: 11.180
- Activaciones: 5

Descripción
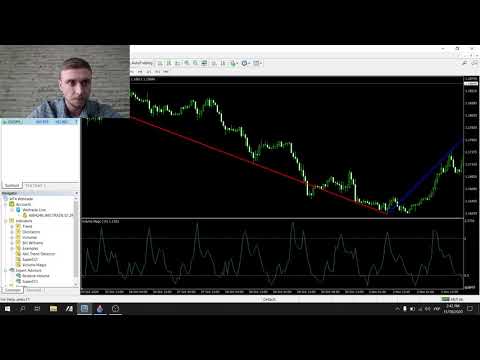
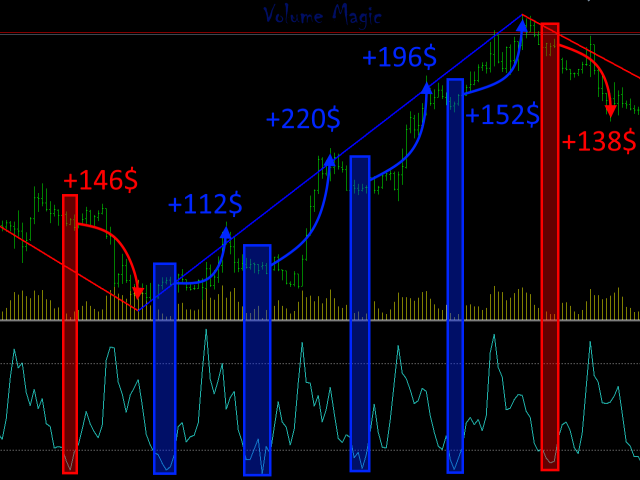
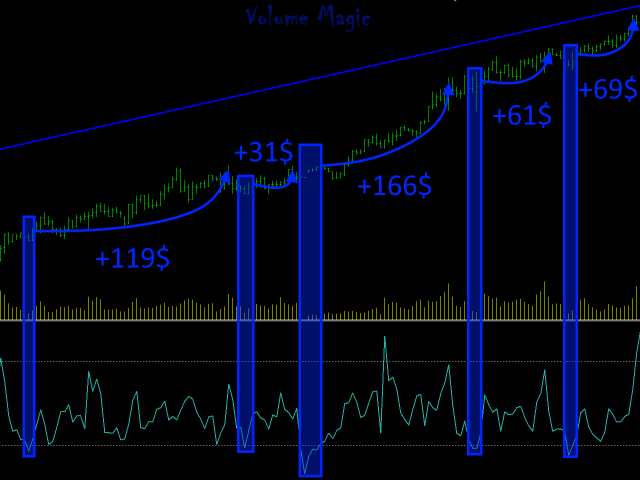
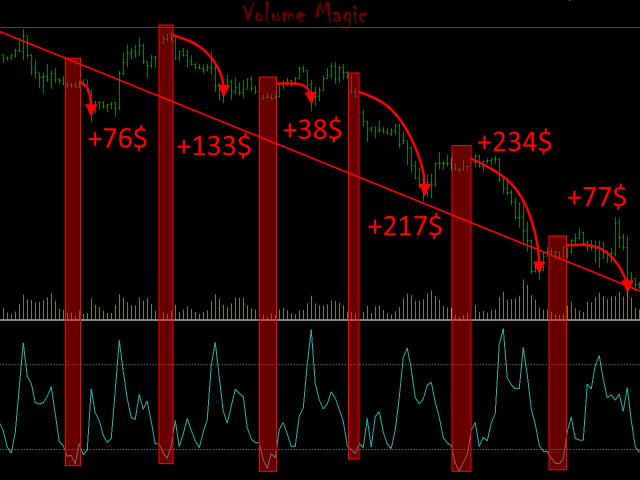
Volume Magic es un indicador que muestra el valor del volumen relativo junto con la dirección de la tendencia actual. La relación entre el volumen actual y el volumen medio de un periodo determinado se muestra en la ventana inferior como un oscilador. La dirección de la tendencia actual se muestra como líneas de tendencia de dos colores.
¿Cómo utilizarlo?
En primer lugar, utilice las líneas de tendencia de dos colores para determinar la dirección de la tendencia actual. A continuación, busque zonas de bajo volumen y abra posiciones en la dirección de la tendencia.
Parámetros
===== _INDICATOR_SETTINGS_ ===== - ajustes del indicador
Máximo de barras históricas - número máximo de barras históricas para calcular el indicador.
Periodo de Volumen - periodo de volumen relativo.
Trend Fast Moving Period - período de la media móvil rápida para la determinación de la tendencia.
Trend Slow Moving Period - periodo de la media móvil lenta para la determinación de la tendencia.
Diferencia de Movimientos - diferencia mínima entre medias móviles(para la determinación de la tendencia).
===== _GRAPHICS_SETTINGS_ ===== - configuración de gráficos
Color de las líneas de tendencia alcista - color de las líneas de tendencia alcista.
Líneas de tendencia descendente Color - color de las líneas de tendencia descendente.
Ancho de las líneas de tendencia - ancho de las líneas de tendencia.