Opening Price
- Indicadores
-
Flavio Javier Jarabeck
 We are a closed brotherhood of traders whose ultimate goal is to profit through well-studied, structured, and automated trades. As a result, we publish dozens of MT5 indicators (FREE and paid) to the global MQL5 community. 80% of our published products are high-quality free indicators so beginner
 - Versión: 1.2
- Actualizado: 27 julio 2020
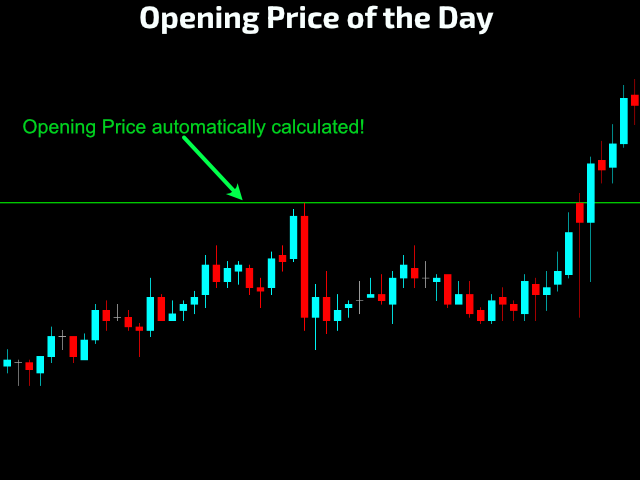
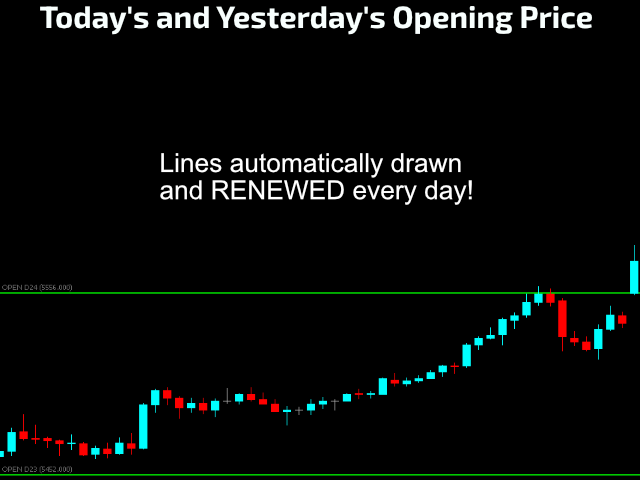
Para aquellos traders de Acción de Precios a los que les encanta operar con puntos de Precios fuertes, como el Precio de Apertura de hoy (o incluso el Precio de ayer), aquí tienen un indicador para facilitar la identificación de esos valores, ¡dibujado directamente en su gráfico! Precio de Apertura dibujará automáticamente una línea que le mostrará este punto para usted, Y, si le gusta cualquier precio de Apertura en el pasado, no sólo el precio de hoy.
¡Un must-have en su caja de herramientas de Acción de Precios!
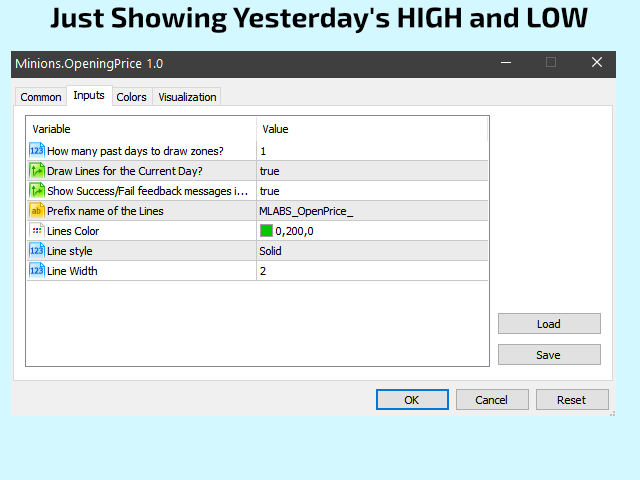
AJUSTES
- ¿Cuántos días pasados quiere que se dibujen?
- ¿Quiere dibujar el Precio de Apertura del día actual?
- ¿Mostrar mensajes de feedback en la pestaña EXPERTOS? (para depurar en caso de problemas)
- Nombre del prefijo a utilizar en las líneas dibujadas
- Color de las líneas
- Estilo de las líneas
- Ancho de las líneas
Si te gusta este indicador, todo lo que te pido es una pequeña Revisión (no un Comentario, ¡sino una REVISIÓN!)...
Esto significará MUCHO para mí... Y de esta manera puedo seguir regalando cosas interesantes de forma gratuita ...
¡Sin ataduras! ¡Nunca!
¡Larga vida y prosperidad!
;)


ok