Distance from Moving Average
- Indicadores
-
Leonardo Sposina
 Software Developer
 - Versión: 1.4
- Actualizado: 8 octubre 2020
- Activaciones: 5
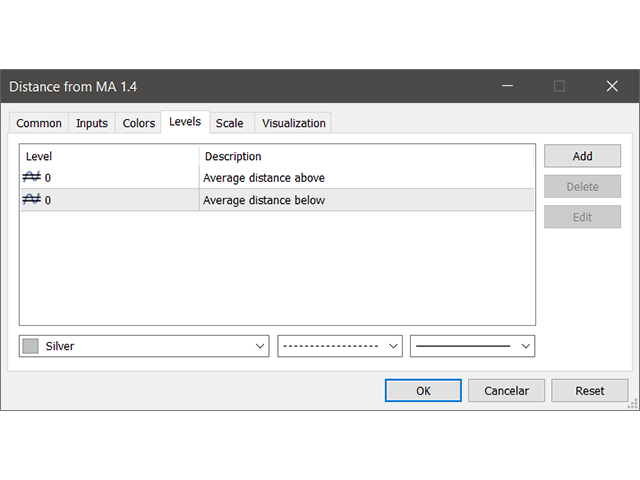
Este indicador mide la mayor distancia entre un precio (máximo o mínimo) y una media móvil. También muestra la distancia media por encima y por debajo de la media móvil.
Puede resultar útil para estrategias que abren posiciones inversas cuando el precio se aleja de una media móvil dentro de un rango determinado, a la espera de que vuelva para poder cerrar la posición.
Funciona en cualquier símbolo y marco temporal.
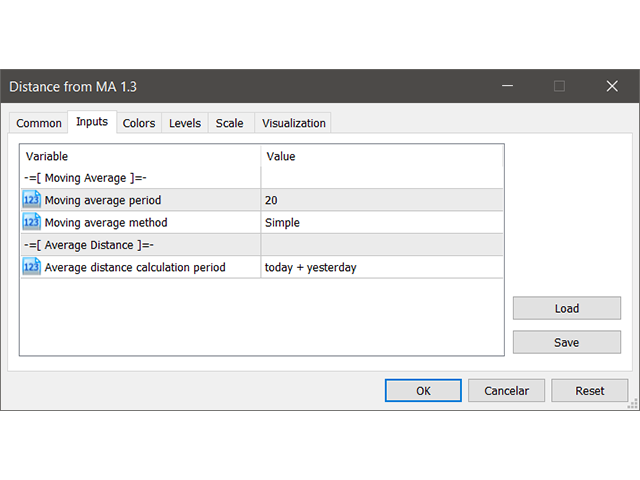
Parameters:
- Periodo de la media móvil: Periodo de cálculo de la media móvil.
- Método de media móvil: Puede elegir entre los métodos de media móvil "Simple", "Exponencial", "Suavizada" y "Ponderada lineal".
- Periodo de cálculo de la distancia media: Periodo de cálculo de la distancia media. Las opciones son "hoy", "hoy + ayer", "hoy + últimos 2 días", "hoy + últimos 3 días", "hoy + últimos 4 días", "hoy + últimos 5 días" y "hoy + últimos 6 días".

El usuario no ha dejado ningún comentario para su valoración