Distance from Moving Average
- 지표
-
Leonardo Sposina
 Software Developer
 - 버전: 1.4
- 업데이트됨: 8 10월 2020
- 활성화: 5
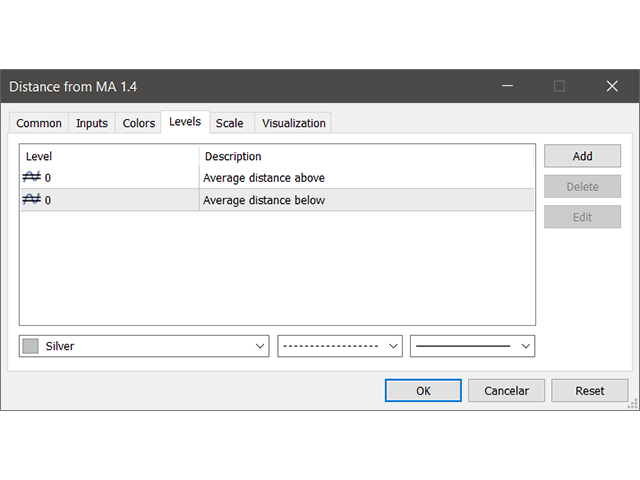
This indicator measures the largest distance between a price (high or low) and a moving average. It also shows the average distance above and below the moving average.
It may come in handy for strategies that open reverse positions as price moves away from a moving average within a certain range, awaiting it to return so the position can be closed.
It just works on any symbol and timeframe.
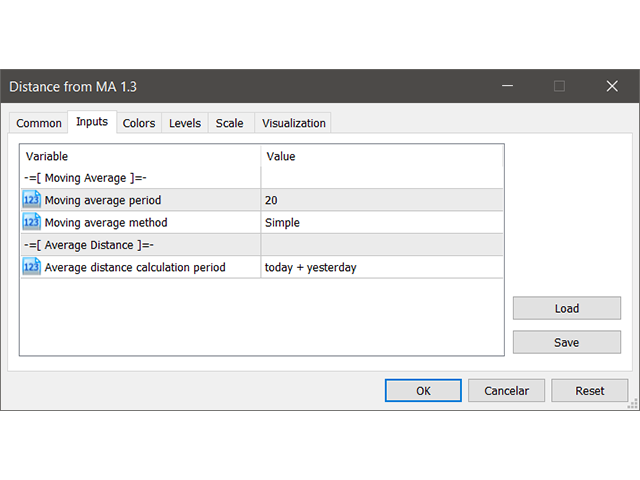
Parameters:
- Moving average period: Period for moving average calculation.
- Moving average method: You can choose between "Simple", "Exponential", "Smoothed" and "Linear-weighted" moving average methods.
- Average distance calculation period: This is the calculation period for the average distance. Options are "today", "today + yesterday", "today + past 2 days", "today + past 3 days", "today + past 4 days", "today + past 5 days" and "today + past 6 days".

사용자가 평가에 대한 코멘트를 남기지 않았습니다