Price Time Correlation
- Indicadores
- Versión: 1.13
- Actualizado: 12 marzo 2019

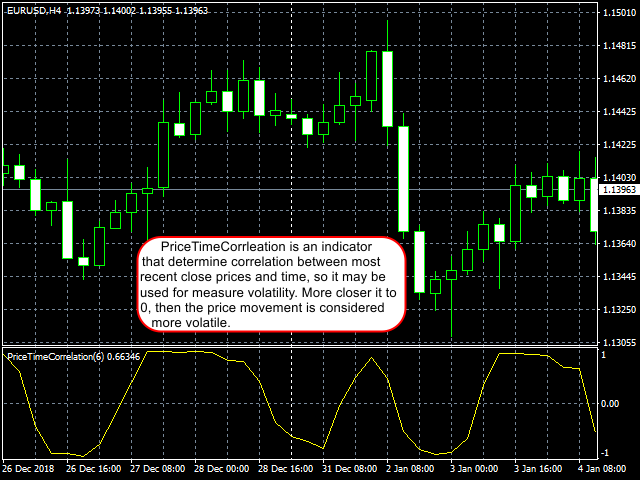
Este indicador determina la volatilidad del precio utilizando la correlación entre el precio y el tiempo.
ADVERTENCIA: No es adecuado para el marco de tiempo 1M, ¡no verá ninguna línea en este marco!
Como usarlo:
- Cuanto más se acerque el valor del indicador a 0, el precio se considera más volátil.
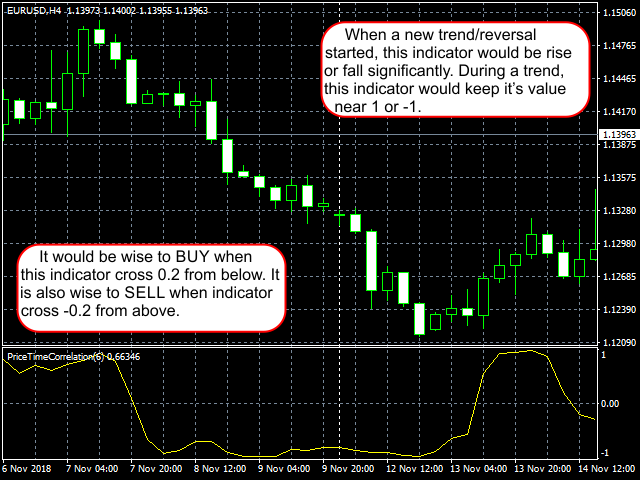
- Cuando se inicia una reversión, el valor del indicador aumenta o disminuye significativamente.
- Durante una tendencia fuerte, el valor del indicador estaría más cerca de 1 o -1, depende de la tendencia actual.
Señal de entrada:
- SEÑAL DE COMPRA: El indicador cruza 0,2 desde abajo. Este valor puede modificarse, siempre que sea superior a 0.
- SEÑAL DE VENTA: El indicador cruza -0,2 desde arriba. Este valor puede modificarse, siempre que sea inferior a 0.
Entrada Descripción:
- PERIODO: Determina cuantas barras se usan para determinar la volatilidad del precio. Se recomienda 6.
- precio_aplicado: Precios a aplicar al indicador. Utilice 1 de estos enteros para utilizarlo: 0 -> Precio de Cierre, 1 -> Apertura, 2 -> Máximo, 3 -> Mínimo, 4 -> Mediana, 5 -> Típico, 6 -> Típico Ponderado

Good indicator.