AOnoisyChannel
- Indicadores
- Versión: 1.2
- Actualizado: 3 febrero 2019
- Activaciones: 5

¿Está utilizando Awesome Oscillator? Me pregunto a qué precios altos y bajos este indicador de color verde? ¿Rojo? Este indicador le ayuda a determinar esos límites.
¡Obtenga un 20% de descuento por el alquiler de 1 año!
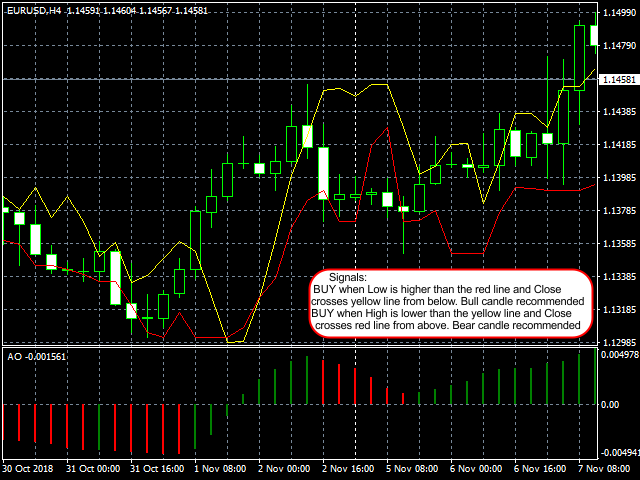
La línea amarilla se llama Línea Superior, y la roja Línea Inferior.
SEÑAL DE COMPRA
En este caso, el color de la última barra AO sería de color Verde.
- Tanto el precio de apertura como el de cierre están por encima de la línea inferior.
- El precio de cierre cruza la Línea Superior desde abajo.
SEÑAL DE VENTA
En este caso, el color AO de la última barra sería Rojo.
- Tanto el precio de apertura como el precio máximo están por debajo de la línea superior.
- El precio de cierre cruza la línea inferior desde arriba.
Caso Especial
A veces la Línea Inferior aparece más alta que la Línea Superior. NO ENTRAR cuando esto suceda, puede ser el resultado de una tendencia previa o una reversión.
Descripción de la Entrada:
baja_sensibilidad: Dibuja un canal más ancho.