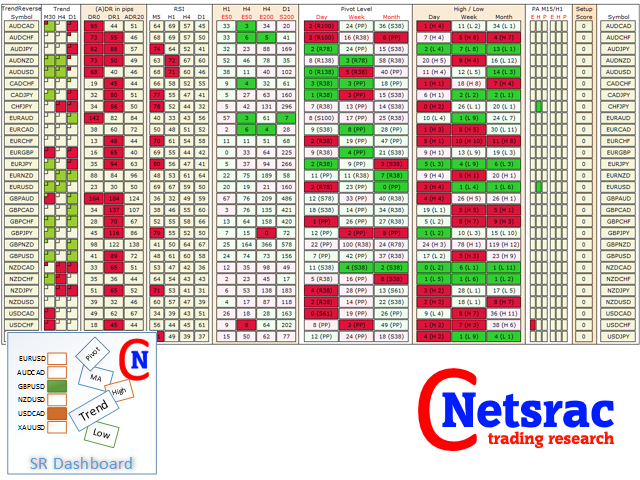
Netsrac SR Dashboard
- Indicadores
- Versión: 2.20
- Actualizado: 22 octubre 2020
- Activaciones: 15

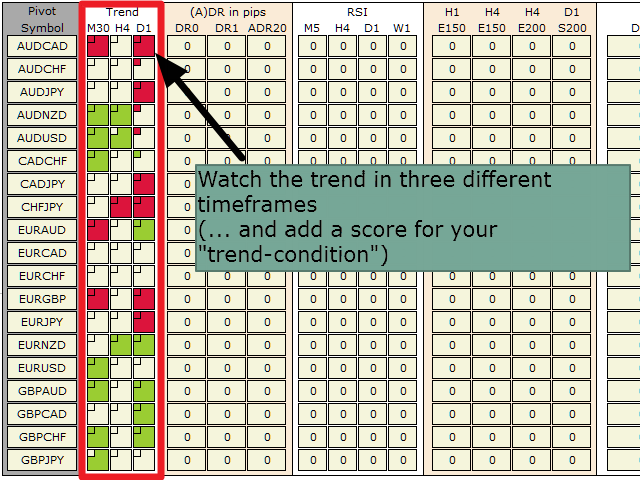
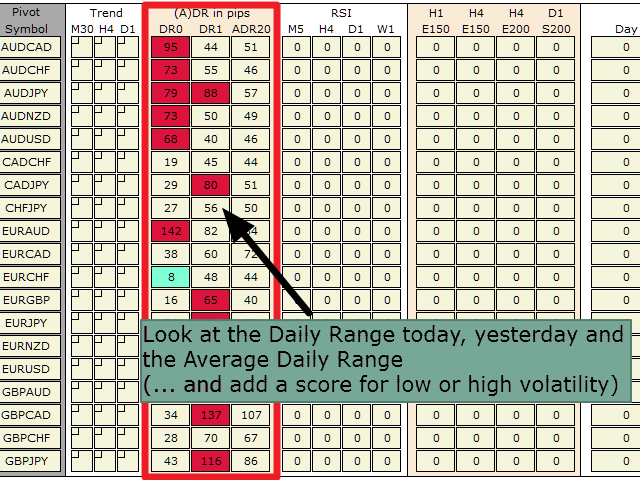
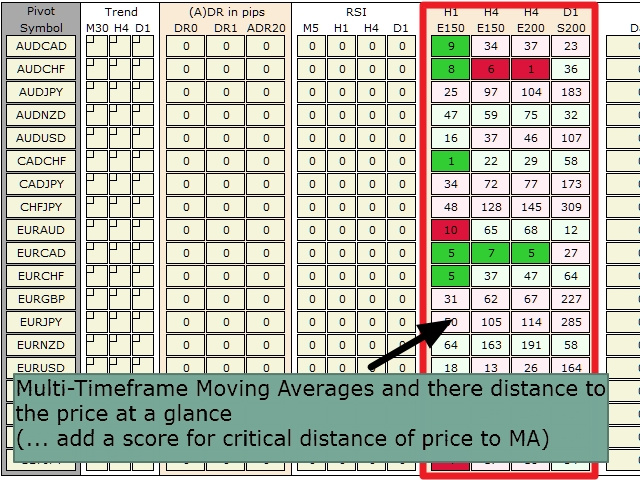
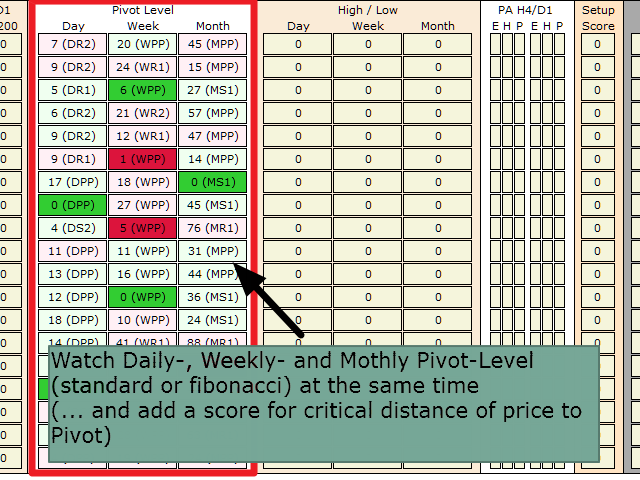
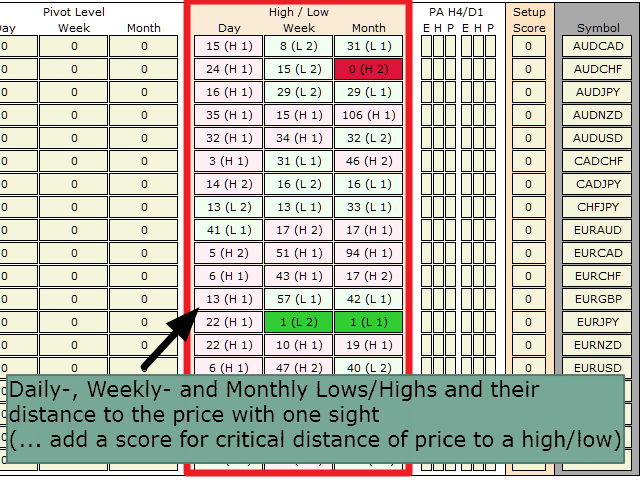
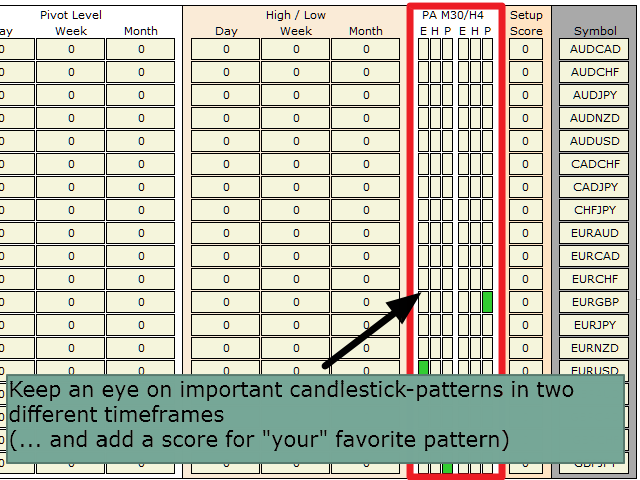
Con el Tablero SR, usted obtiene una poderosa herramienta para controlar parte de la información más importante en el trading. Montar una configuración de acuerdo a su estrategia y ser informado tan pronto como esta configuración es válida. Asigne puntuaciones a condiciones definidas y deje que el Tablero las encuentre. Elija entre Tendencia, Rango Medio Diario, RSI, Medias Móviles, Pivote (Diario, Semanal, Mensual), Máximos y Mínimos, Patrones de Velas.
Nota: Este indicador no se puede utilizar en el Probador de Estrategias. La versión demo aquí desde el mercado no funciona. Por favor, utilice la versión gratuita del indicador para las pruebas: https: //www.mql5.com/de/market/product/34863
¿Qué puede hacer con esta herramienta?
Utilice el cuadro de mandos como una potente herramienta para sus operaciones discrecionales. Podrá ahorrar mucho tiempo en la pantalla.
Con el Tablero SR, usted será capaz de encontrar algunas configuraciones de trading interesantes de una manera más rápida e inteligente. Algunas de estas configuraciones se describen en nuestra nueva serie de blogs:
- Usando el "Netsrac SR Dashboard" (guía rápida)
- Operando con Pinbars
- Set-Gets rápidos con el Dashboard
- Operar el patrón envolvente
- Pivote semanal como potencial punto de reversión
- Operar la tendencia a corto plazo
- Trading de tendencia con medias móviles importantes
- Brote de volatilidad
- ... (puede continuar)
Manual


great product really helps you out with your trading