Stochastic Alerts
- Indicadores
- Versión: 1.1
- Actualizado: 13 enero 2020
- Activaciones: 20

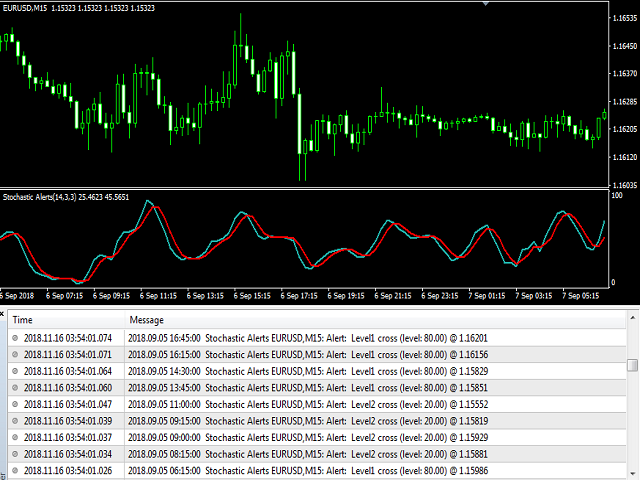
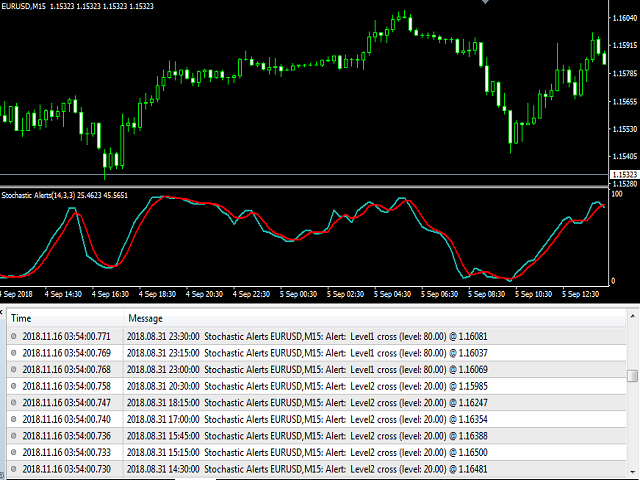
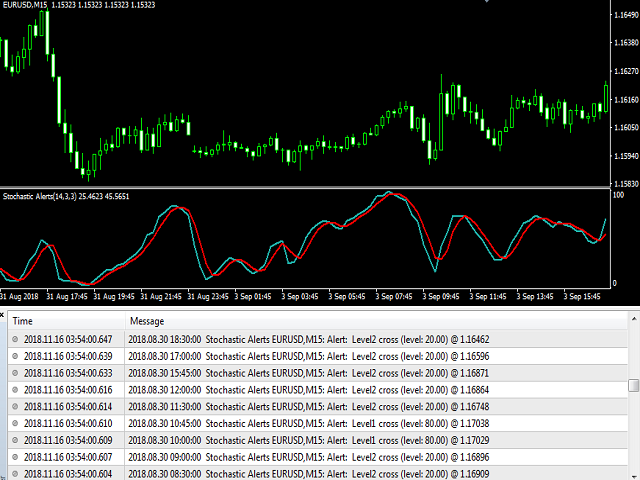
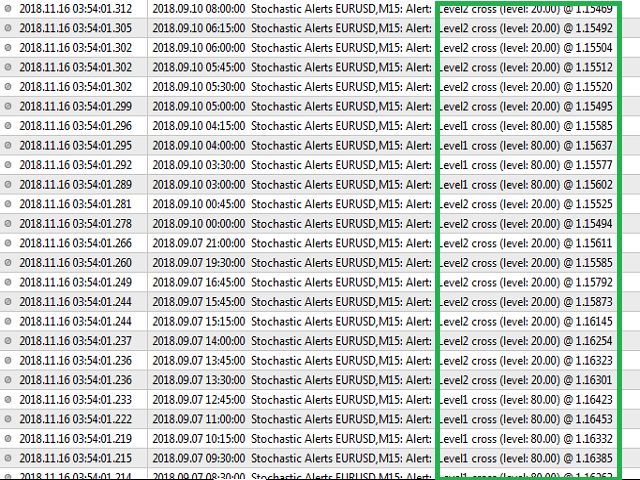
El indicador Estocástico Alertas es un modelo avanzado del indicador estocástico estándar. Este indicador es diferente del indicador estándar 2 se ha añadido la función de alerta de nivel.
Por ejemplo, el usuario podrá recibir alertas en niveles superiores a 80 e inferiores a 20. Puede cambiar los niveles que desee. Por ejemplo 60 y 40 puede hacer. Esto depende de la discreción del usuario. puede activar o desactivar las alertas como desee.
Parámetros
- Kperiod - Ajuste estándar del kperiod estocástico
- Dperiod - Ajuste estocástico estándar del dperiod
- Ralentización - Ajuste estocástico estándar de la ralentización
- Nivel1- Nivel de ajuste de la primera alerta.
- Level2 - Segundo nivel de advertencia
- PopupAlerts - Configuración de alertas mt4
- EmailAlerts - Configuración de alertas por correo electrónico
- PushNotificationAlerts - Configuración de alertas de aplicaciones móviles.