Stochastic Alerts
- Indikatoren
- Version: 1.1
- Aktualisiert: 13 Januar 2020
- Aktivierungen: 20

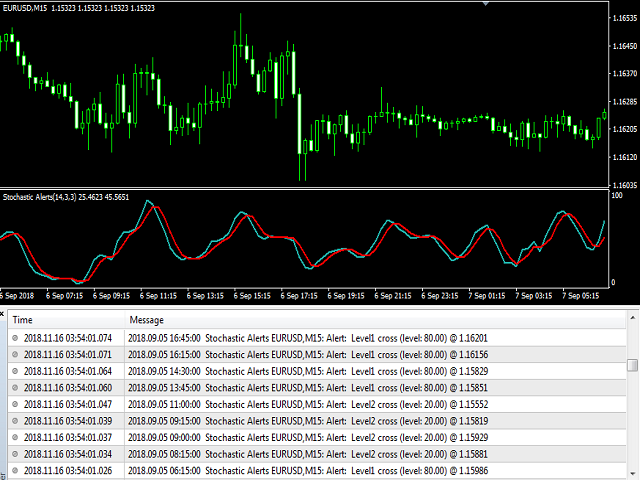
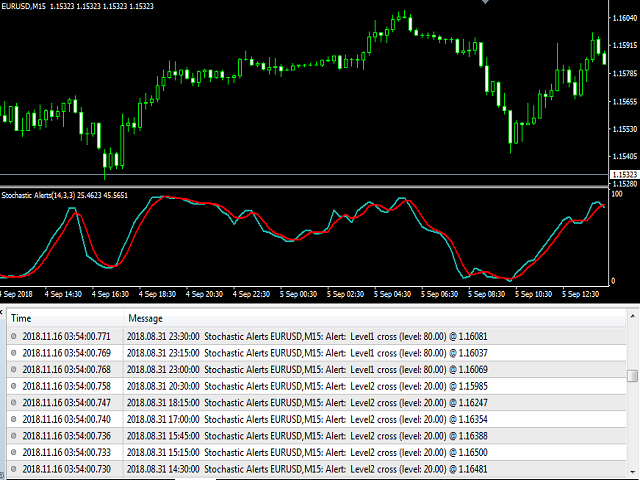
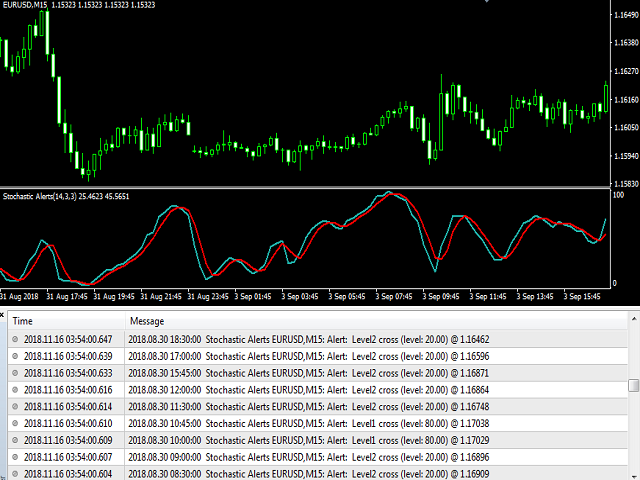
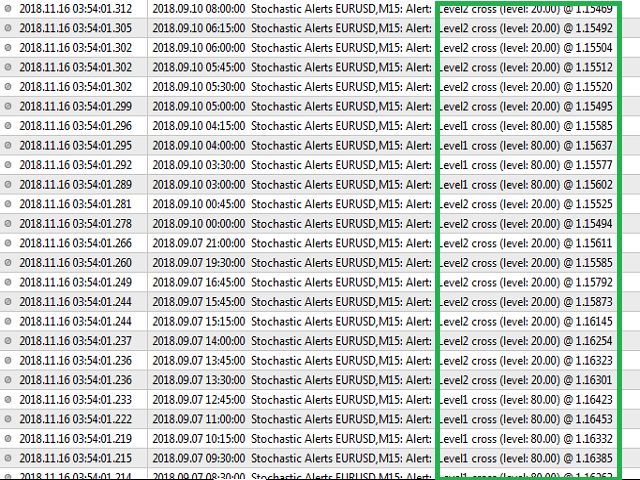
Der Stochastic Alerts Indikator ist ein erweitertes Modell des stochastischen Standardindikators. Dieser Indikator unterscheidet sich vom Standard-Indikator durch 2 zusätzliche Warnstufen.
Zum Beispiel kann der Benutzer Warnungen bei Niveaus über 80 und unter 20 erhalten. Es kann die Ebenen, die Sie wollen. Zum Beispiel 60 und 40 tun können. Dies hängt vom Ermessen des Benutzers ab. Sie können die Warnungen nach Wunsch ein- oder ausschalten.
Parameter
- Kperiod - Standardmäßige stochastische Kperiod-Einstellung
- Dperiod - Standardeinstellung für stochastische Dperioden
- Verlangsamung - Standardeinstellung für die stochastische Verlangsamung
- Level1 - erste Warnstufe.
- Level2 - zweite Warnstufe
- PopupAlerts - Einstellung für mt4-Warnungen
- EmailAlerts - Einstellung für E-Mail-Warnungen
- PushNotificationAlerts - Einstellung für Warnungen bei mobilen Anwendungen.