Pivot Points Pro
- Indicadores
- Versión: 1.1
- Actualizado: 31 agosto 2022
- Activaciones: 6

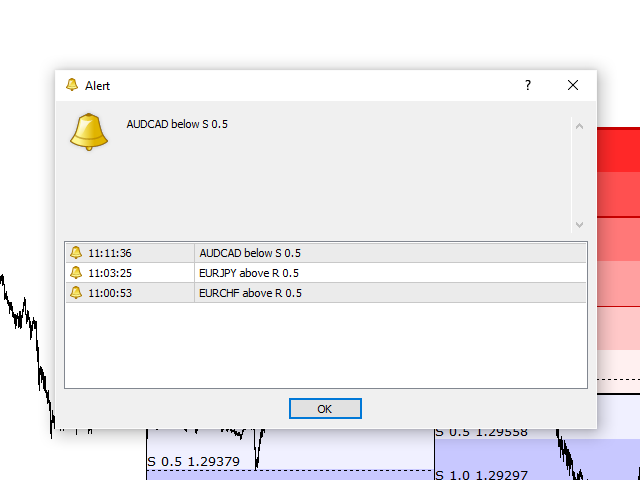
Este indicador se basa en el concepto clásico de puntos pivote combinado con optimizaciones adicionales y funciones avanzadas. Los niveles de soporte y resistencia se calculan teniendo en cuenta la volatilidad histórica media. El escáner multisímbolo añadido le permite detectar las mejores condiciones y configuraciones comerciales. Puede ver en tiempo real la situación actual de todos sus símbolos favoritos y puede cambiar el gráfico a cualquier símbolo con un solo clic. El sistema de alertas incorporado le permite centrarse en otras tareas mientras el indicador trabaja en segundo plano. Con este sistema nunca perderá las buenas oportunidades y siempre obtendrá las mejores señales sin necesidad de vigilar el mercado constantemente.
Características
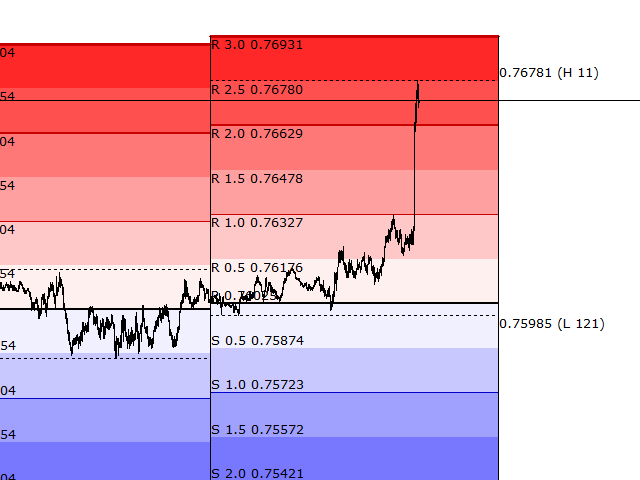
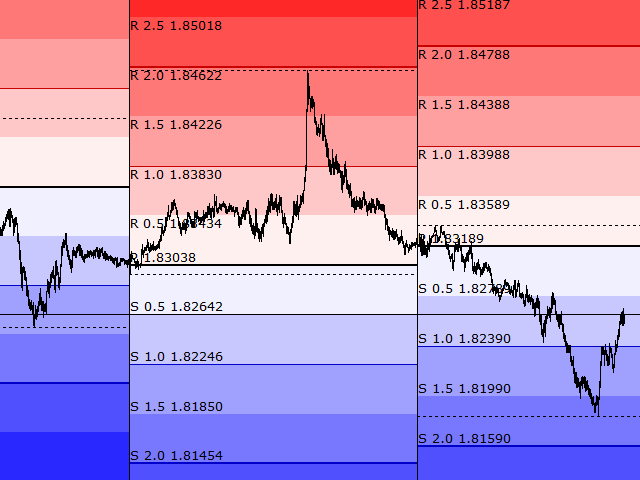
- Concepto clásico de Puntos Pivote combinado con una fórmula de volatilidad mejorada para el cálculo de los niveles de soporte y resistencia.
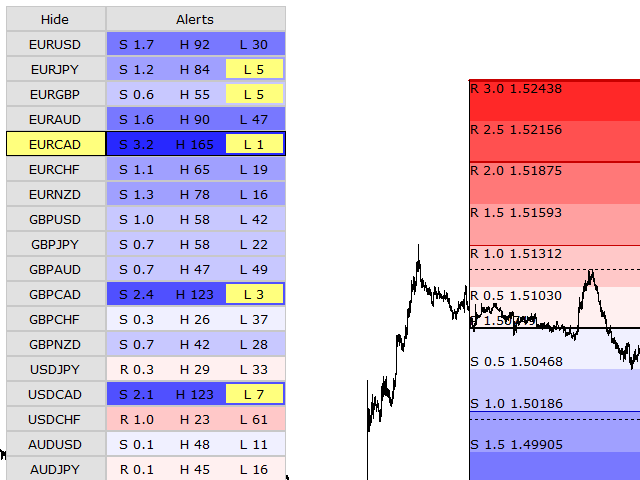
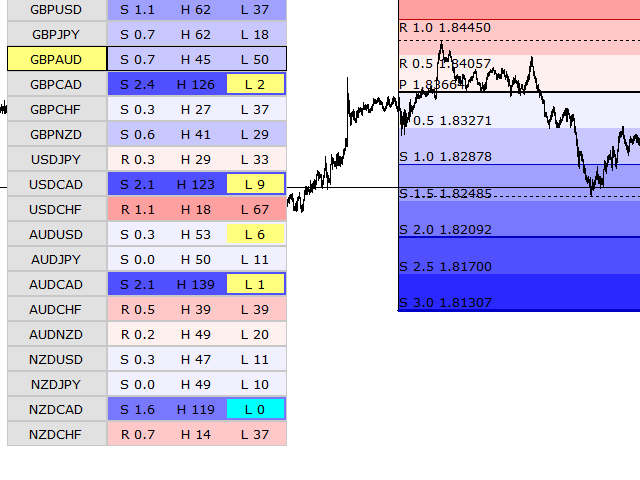
- Escáner y panel multisímbolo que le permite supervisar un gran número de símbolos y cambiar de símbolo con un solo clic.
- Indicadores adicionales que le dan señales visuales cuando el precio actual está cerca o es igual al más alto o al más bajo del día. También puede ver la distancia relativa medida en puntos de volatilidad.
- El sistema de alertas integrado con ajustes precisos le permite activar alertas sólo para determinados niveles.
- Muchas opciones diferentes para personalizar el indicador. Puede activar o desactivar algunas funciones.
- El indicador se sincroniza automáticamente con la ventana Market Watch en MetaTrader 4, donde puede establecer listas personalizadas con símbolos.
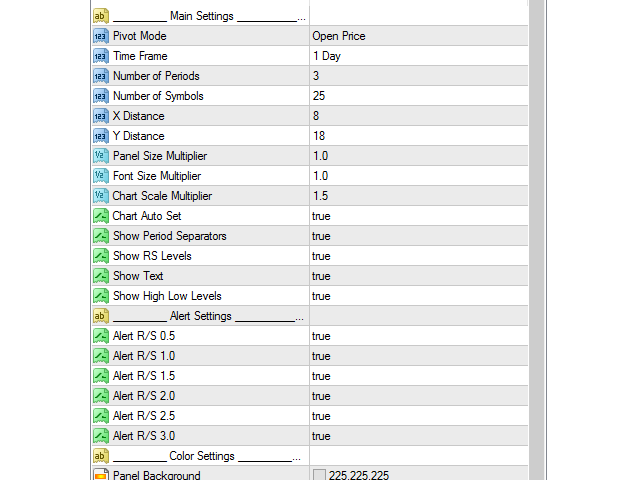
Ajustes
Ajustes principales
- Modo de pivote - determina el cálculo del punto de pivote central. Por defecto se utiliza el precio de apertura.
- Time Frame - marco de tiempo para el cálculo del indicador.
- Número de Períodos - cuántos períodos mostrar en el historial.
- Número de Símbolos - número de símbolos en la lista.
- DistanciaX - distancia horizontal desde la esquina superior izquierda.
- Distancia Y - distancia vertical desde la esquina superior izquierda.
- Multiplicador deltamaño del panel - aumenta o disminuye el tamaño de la interfaz.
- Multiplicador deltamaño de la fuente - aumenta o disminuye el tamaño de la fuente.
- Multiplicador de escala del gráfico - controla la escala vertical del gráfico.
- Autoconfiguración del gráfico - verdadero/falso para la configuración automática del gráfico.
- Mostrar Separadores de Periodos - verdadero/falso.
- Mostrar Niveles RS - verdadero/falso.
- Mostrar Texto - true/false.
- Mostrar niveles altos y bajos - verdadero/falso.
Configuración de alertas
- Alerta R/S 0.5 - verdadero/falso.
- Alerta R/S 1.0 - verdadero/falso.
- Alerta R/S 1.5 - verdadero/falso.
- Alerta R/S 2.0 - verdadero/falso.
- Alert R/S 2.5 - true/false.
- Alerta R/S 3.0 - verdadero/falso.
Ajustes de color
- Ajustes de color.