Moving Above Average MT5
- Indicadores
- Versión: 1.9
- Actualizado: 20 noviembre 2021
- Activaciones: 5

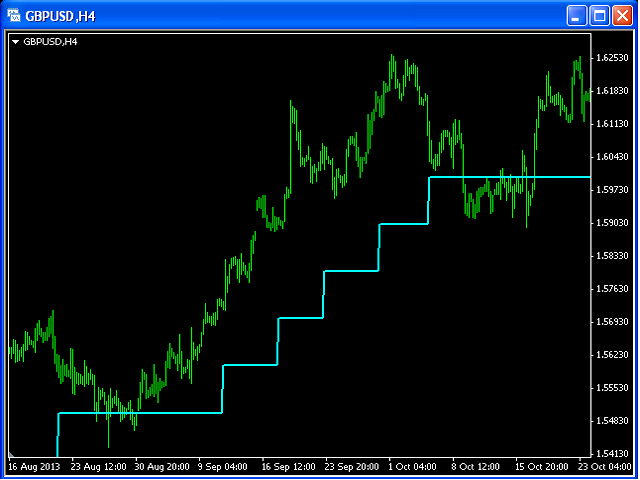
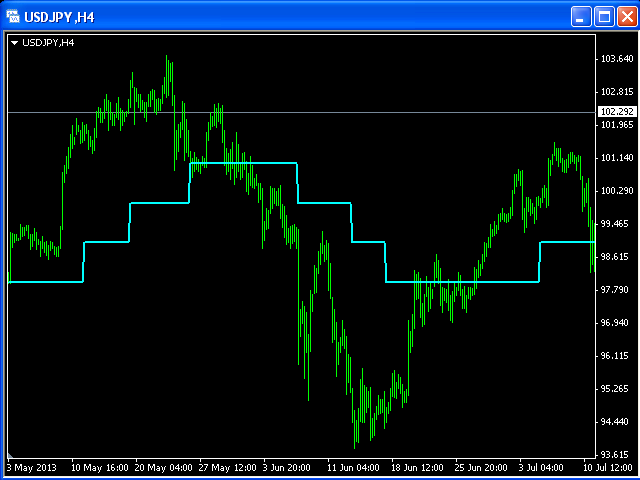
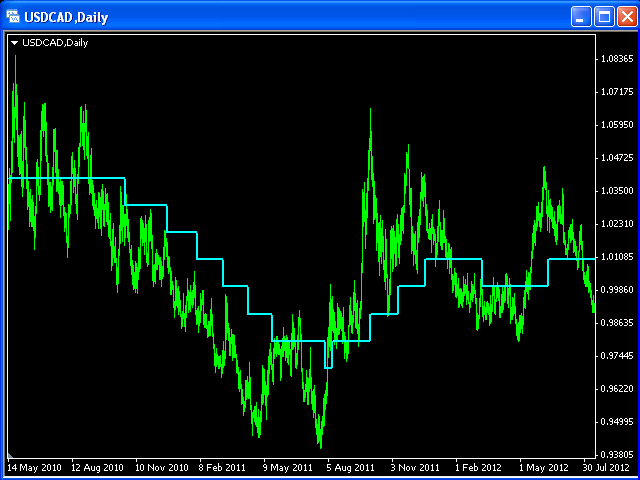
Una media móvil se utiliza habitualmente con datos de series temporales para suavizar las fluctuaciones a corto plazo y determinar tendencias a más largo plazo. El indicador propuesto tiene capacidad para aumentar un efecto de suavización.
Este indicador podría desempeñar un papel importante en la determinación de soportes y resistencias.
Un parámetro de entrada nPeriod determina el número de barras para el cálculo de la media móvil.