MOR Smart Gap
- Indicadores
- Versión: 2.9
- Activaciones: 7

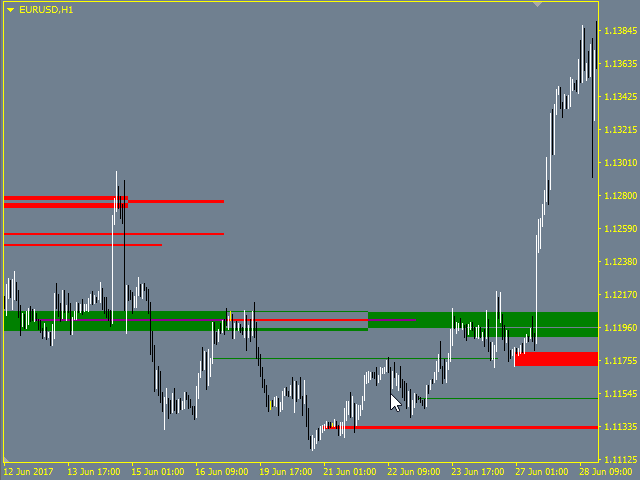
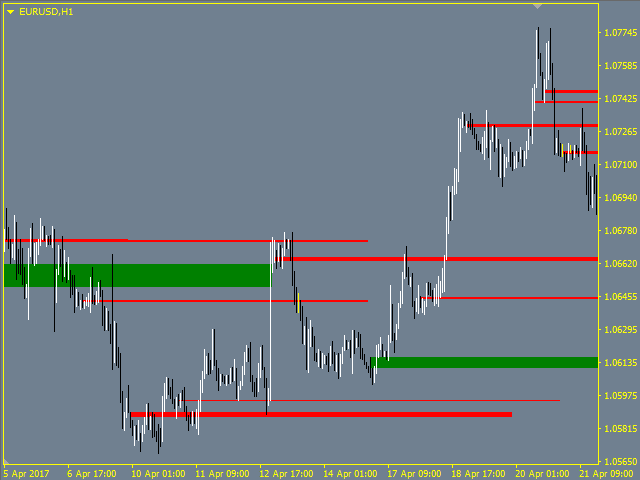
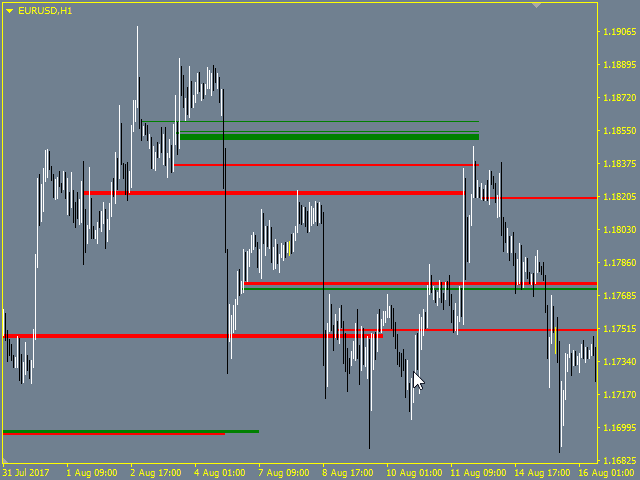
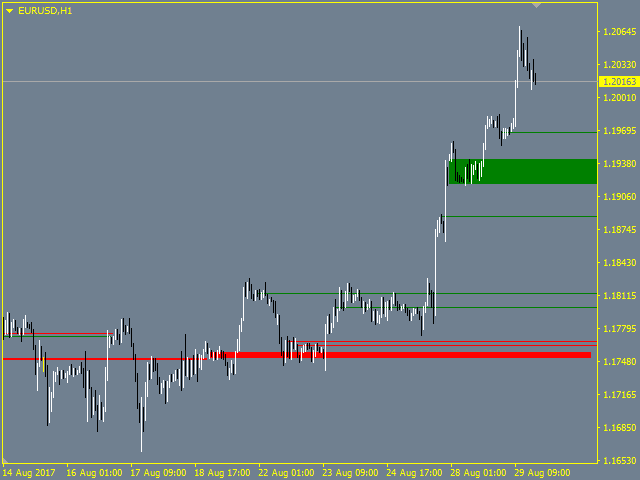
El indicador encuentra y visualiza las brechas de precios, que a menudo pueden utilizarse como niveles de soporte y resistencia. Puede mostrar niveles de diferentes marcos temporales en un gráfico.
Entradas Valor
- Label - mostrar/ocultar el marco temporal de los niveles construidos
- TimeFrame - selecciona el marco temporal desde el que dibujar los niveles
- DrawRangeDay - la longitud del nivel en días
- DrawRangeHour - la longitud del nivel en horas
- GapSizeForDrawing - un nivel será dibujado si la brecha es igual o mayor que este nivel en puntos.
- CountDays - el número de días a buscar o gaps de precios
- GAP_UP - el color del gap superior
- GAP_DOWN - el color del gap inferior
- Label_X, Label_Y - coordenadas de la etiqueta que muestra el marco temporal de los niveles