TSO Fibonacci Chains
- Indicadores
-
Dionisis Nikolopoulos
 We are a small team of individuals with a strong passion for trading.
Our research is focused in the area of trading methods and mechanical trading systems
developed on the MT4 and MT5 trading platforms.
Many more features will be coming in the future, so stay with us! - Versión: 3.1
- Actualizado: 15 septiembre 2020
- Activaciones: 10
El retroceso de Fibonacci es un método de análisis técnico para determinar los niveles de soporte y resistencia. El Indicador de Cadenas de Fibonacci TSO se diferencia de un simple indicador de Retrocesos de Fibonacci en que proporciona los objetivos para cada nivel de retroceso. En otras palabras, hay un nivel de extensión (D) para cada nivel de retroceso (C). Además, si se alcanza un nivel de extensión, se crea automáticamente una nueva configuración de Fibonacci. Estas configuraciones Fibonacci consecutivas crean una cadena que revela información muy útil sobre un activo y ayuda a tomar mejores decisiones de trading.
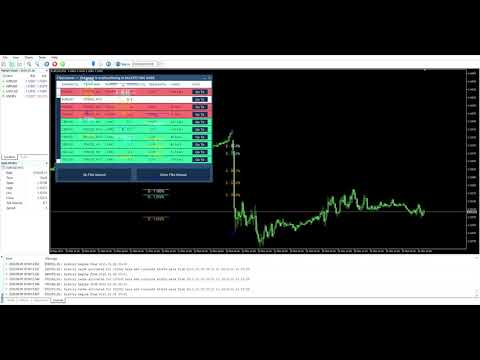
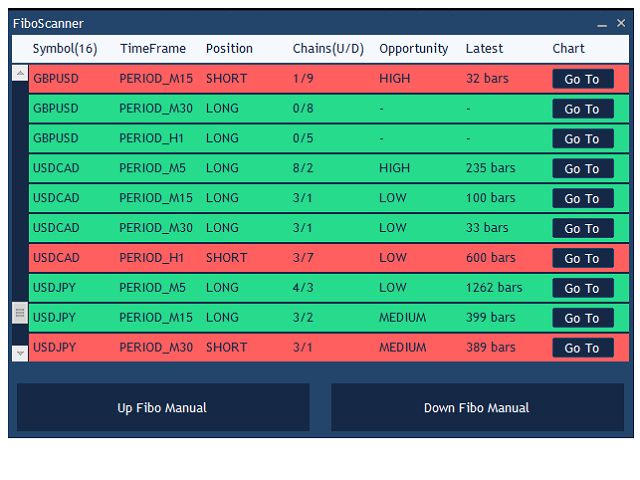
SCANNER está incluido. Ahora con el Escáner de Fibonacci puedes encontrar oportunidades de trading y configuraciones de trading de forma fácil y rápida.
Cómo funciona:
- El indicador escanea todo el gráfico para detectar los puntos de mayor y menor nivel de precios.
- A continuación, comienza a calcular las cadenas de Fibonacci hasta el día de hoy.
- En el gráfico, sólo se muestran las últimas cadenas de Fibonacci de tendencia alcista y bajista.
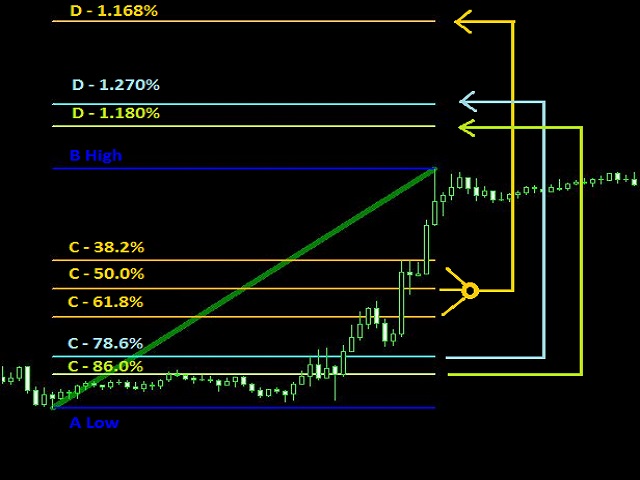
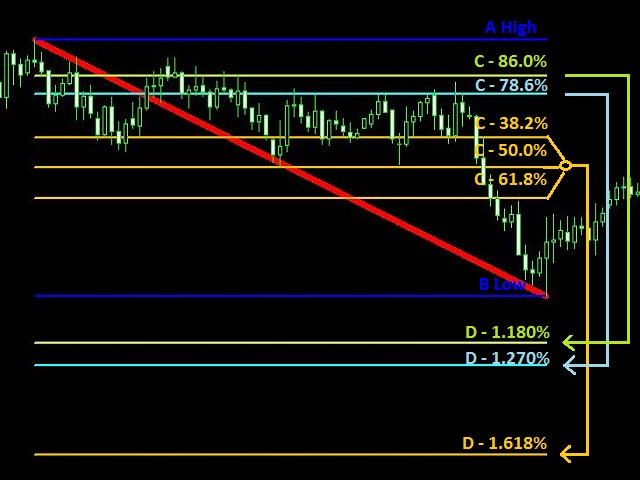
Niveles de Fibonacci:
- Α: Mínimo (Tendencia alcista) / Máximo (Tendencia bajista)
- B: Máximo (tendencia alcista) / Mínimo (tendencia bajista)
- C: Retroceso (siempre en el mínimo más bajo (tendencia alcista) o el máximo más alto (tendencia bajista) dentro del rango A-B)
- D: Extensión (objetivo)
Niveles de retroceso C y niveles de extensión D:
- 38.2% - > 1.618%
- 50.0% - > 1.618%
- 61.8% - > 1.618%
- 78.6% - > 1.270%
- 86.0% - > 1.180%
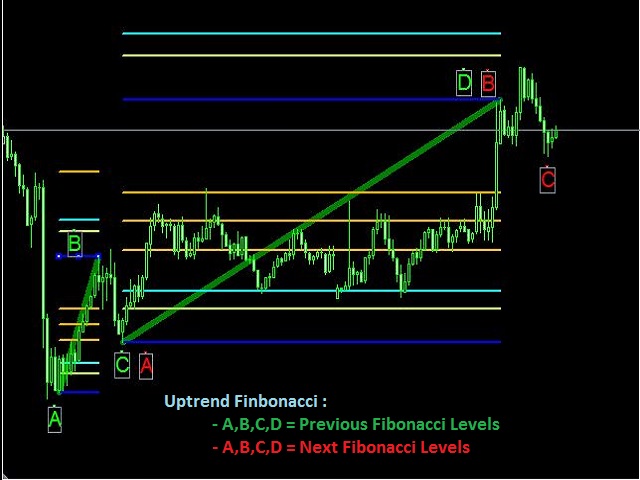
Cálculo de Fibonacci
- Cuando se han formado los niveles A, B y C seguidos de un ALTO/MÍNIMO* en el nivel D correspondiente, el bloque Fibonacci actual se considera completo y se inicia un nuevo bloque.
- Los niveles A y B del nuevo bloque Fibonacci se basan en el bloque anterior, es decir, Α_nuevo = C_viejo y B_nuevo = D_viejo. De este modo, se forma una cadena de bloques de Fibonacci consecutivos, siendo el último bloque el activo.
- La cadena se rompe cuando el precio se mueve por debajo (tendencia alcista) o por encima (tendencia bajista) del nivel A del último bloque de Fibonacci.
*un ALTO/BAJO se produce cuando la tercera vela (del medio) de 5 velas consecutivas tiene un ALTO/BAJO mayor/menor que las dos velas anteriores y posteriores.
Estrategias
- Dos primeros pasos para cualquier estrategia
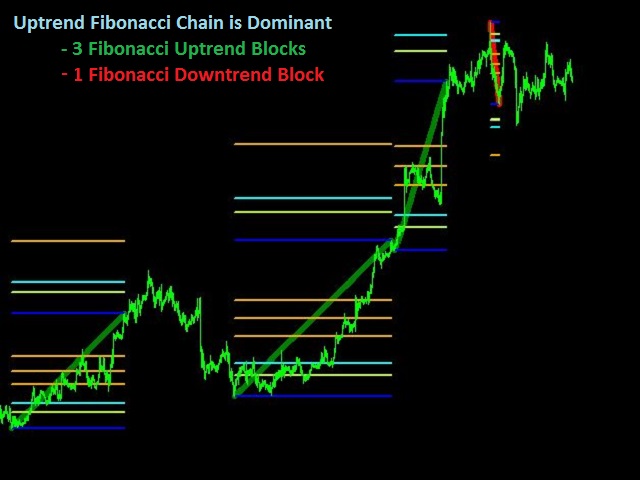
- Localice las últimas cadenas Fibonacci válidas (que contengan al menos 2 bloques Fibonacci completos) de tendencia alcista y bajista.
- Seleccione la dominante, es decir, la dirección (alcista o bajista) que contenga más bloques de Fibonacci completos en su última cadena.
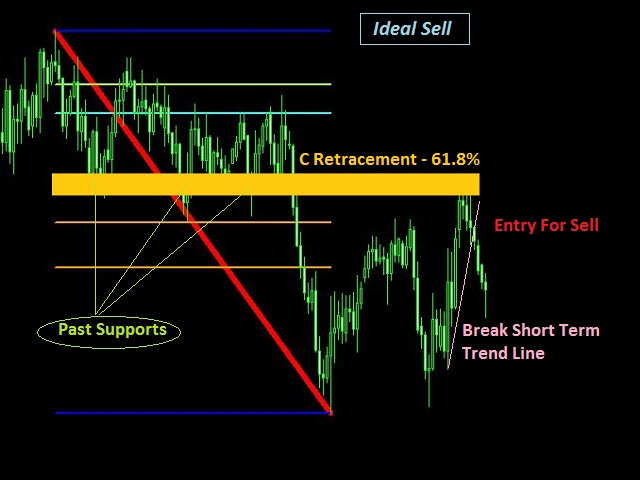
- Conservador
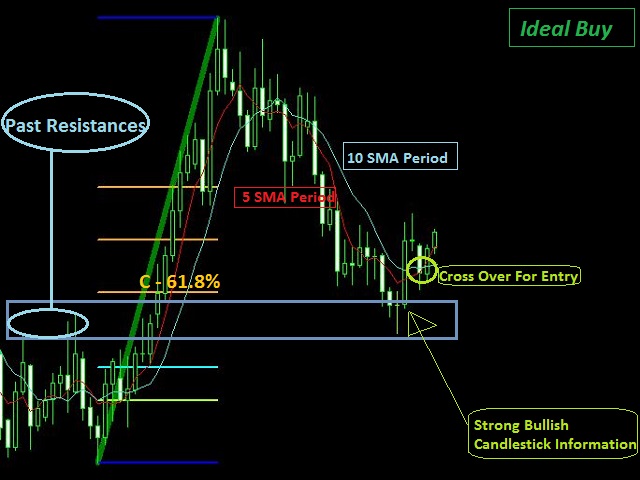
- Para la cadena dominante, busque niveles anteriores de soporte/resistencia cercanos a los niveles C (61,8%, 78,6% y 86,0%)*.
- Espere a que se cree un MÍNIMO/ALTO en estos niveles (si la cadena de Fibonacci de tendencia alcista o bajista es dominante respectivamente)
- Si se cumplen los criterios anteriores, entre utilizando una estrategia de entrada, como un patrón de velas, la ruptura de una línea de tendencia, el cruce de una media móvil (por ejemplo, MA de 5 y 10 periodos), etc.
- El nivel más seguro para el Stop Loss es unos pips por encima (tendencia bajista) o por debajo (tendencia alcista) del nivel A del último bloque de Fibonacci. El Take Profit debe colocarse en el nivel D correspondiente.
- Stop Loss y Take Profit también se pueden establecer como en el paso 3 de la Estrategia Agresiva.
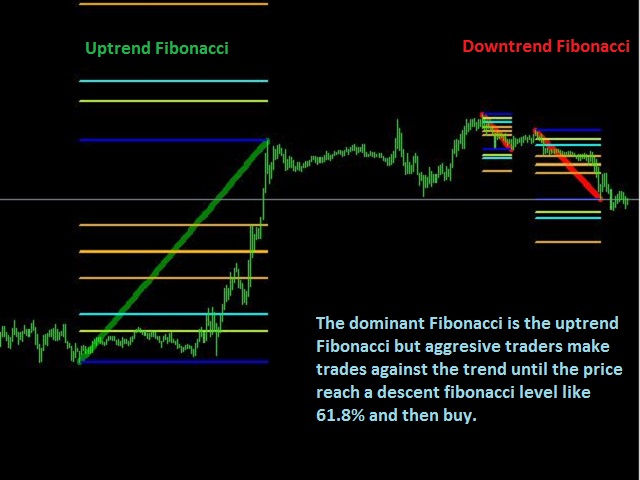
- Agresivo
- Para la cadena dominante, espere a que se forme una C BAJA/ALTA (cadena de Fibonacci de tendencia alcista/bajista respectivamente) en cualquier nivel de Fibonacci.
- Si se cumplen los criterios anteriores, entre utilizando una estrategia de entrada como un patrón de velas, una ruptura de la línea de tendencia, una media móvil cruzada (por ejemplo, MAs de 5 y 10 periodos), etc.
- Coloque el Stop Loss unos pips por encima del LOW actual (tendencia alcista) o por debajo del HIGH actual (tendencia bajista) y un Take Profit en el nivel de extensión D correspondiente o a una distancia 2-3 veces mayor que el Stop Loss (Relación Riesgo/Recompensa 1:2 ó 1:3).
- Si los criterios anteriores se cumplen más de una vez, cree posiciones adicionales con niveles de Stop Loss y Take Profit como se describe en el paso 3.
- En caso de que una posición se cierre debido a que el nivel de precios alcanza el Stop Loss, abra de nuevo la misma posición si se vuelven a cumplir los mismos criterios.
- Muy agresivo
- Para la cadena dominante, coloque órdenes pendientes en varios niveles de Fibonacci (por ejemplo, 61,8%, 78,6% y 86,0%).
- Coloque el Stop Loss unos pips por encima (tendencia bajista) o por debajo (tendencia alcista) del nivel A del último bloque de Fibonacci. El Take Profit debe colocarse en el nivel D correspondiente (1,270%).
- Siga este procedimiento para cada nuevo Fibonacci creado.
Been using this indicator for sometime (since the original version) and it is one of the best fibonacci tool that you can find in the market that automatically plots fibonacci retracements and target D extensions. If you have good understanding on how fibonacci works with market structure, this tool will definitely help you.
Nice addition to the recent update for placing fibonacci manually