TSO Moving Average Slope Combination
- Indicadores
-
Dionisis Nikolopoulos
 We are a small team of individuals with a strong passion for trading.
Our research is focused in the area of trading methods and mechanical trading systems
developed on the MT4 and MT5 trading platforms.
Many more features will be coming in the future, so stay with us! - Versión: 2.0
- Actualizado: 23 diciembre 2020
- Activaciones: 10
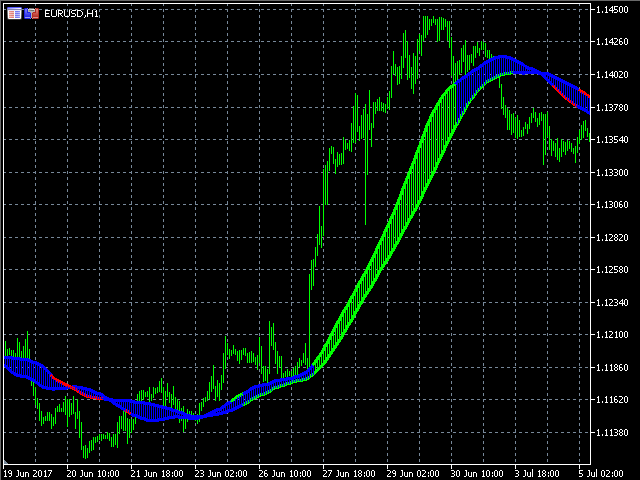
La pendiente de la media móvil (MAS) se calcula detectando el nivel de la media móvil de hace n periodos y comparándolo con el nivel de la media móvil actual. De este modo, la tendencia de la media móvil puede dibujarse en la línea de la media móvil. Este indicador permite comparar las pendientes de dos medias móviles (rápida y lenta) para anular el ruido y proporcionar señales de entrada y salida de mejor calidad.
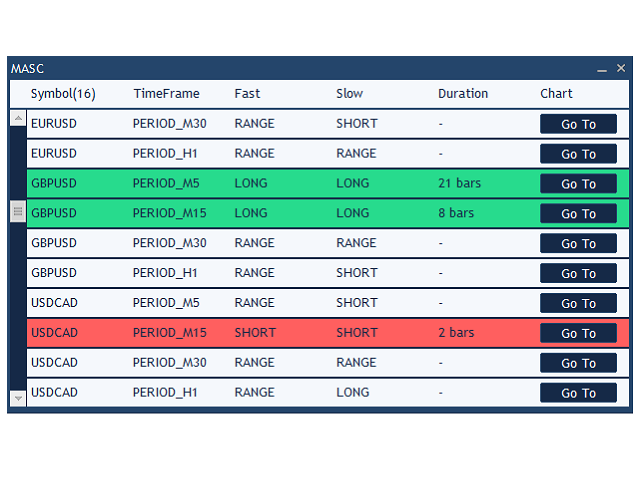
Se incluye SCANNER. Ahora con Scanner puedes encontrar oportunidades de trading y setups de forma fácil y rápida.
Características
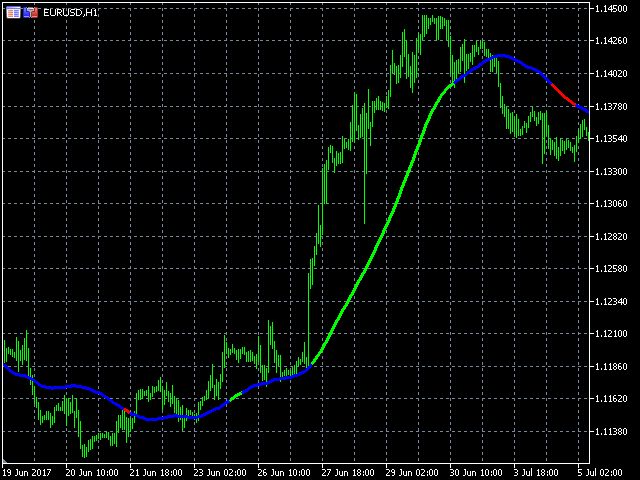
- Observe las tendencias alcistas y bajistas de un vistazo.
- Soporta múltiples métodos de medias móviles.
- Añade una segunda MA (de diferente periodo/tipo) para confirmar las señales.
- El indicador no repinta.
- Puede ser utilizado como parte de un EA. (ver Para Desarrolladores de EAs)
Métodos de Media Móvil soportados
- Media móvil simple (SMA)
- Media móvil exponencial (EMA)
- Media móvil suavizada (SMA)
- Media móvil lineal ponderada (SMMA)
- Media móvil exponencial doble (DEMA)
- Media móvil exponencial triple (TEMA)
- Media móvil adaptativa fractal (FAMA)
- Media móvil adaptativa (AMA)
- Media dinámica de índice variable (VIDYA)
Cálculo de la pendiente
- La pendiente se calcula restando el precio de la media móvil de hace n periodos del precio actual de la media móvil.
- A continuación, la pendiente se clasifica (ascendente, descendente, horizontal) y se codifica por colores (verde, rojo, azul) en función del rango medio real (ATR) de n periodos atrás.
- Si el precio actual de la media móvil es superior al precio de la media móvil n-períodos atrás en más del ATR n-períodos atrás, la pendiente se considera positiva (verde).
- Si |Precio(actual) > Precio(n-periodos)| y |Precio(actual)-Precio(n-periodos)| > |ATR(n-periodos)|, entonces Pendiente > 0
- Si el precio actual de la media móvil es inferior al precio de la media móvil n-periodos atrás en más del ATR n-periodos atrás, la pendiente se considera negativa (rojo).
- Si |Precio(actual) < Precio(n-periodos)| y |Precio(actual)-Precio(n-periodos)| > |ATR(n-periodos)|, entonces Pendiente < 0
- Si el precio actual de la media móvil es mayor o menor que el precio de la media móvil n-periodos atrás pero su distancia es menor que el ATR n-periodos atrás, la pendiente se considera horizontal (azul).
- Si |Precio(actual) - Precio(n-periodos)| < |ATR(n-periodos)|, entonces Pendiente = 0
Entradas
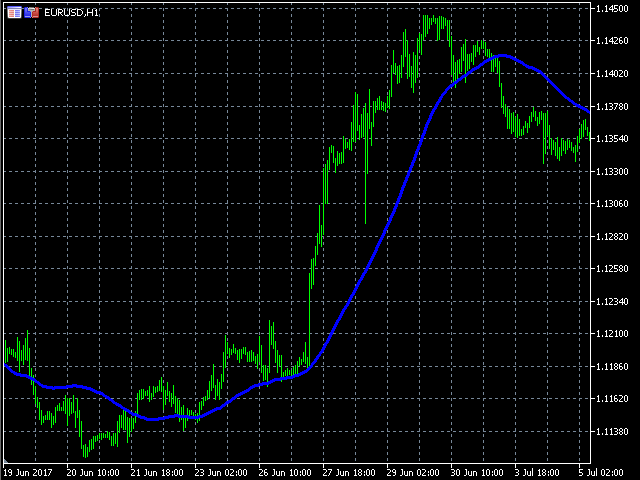
- Método de Media Móvil Rápida / Lenta: El método utilizado para calcular la MA. Seleccione 'Desactivar' en una de las dos entradas para desactivarlo y utilizar una única MA.
- Periodo: El periodo de la MA.
- Desplazamiento: El número de periodos para desplazar la MA.
- Precio Aplicado: El nivel de precio de la vela que se utilizará para los cálculos de MA.
- Pendiente: El número (n) de periodos a mirar hacia atrás para el cálculo de la pendiente.
- Período ATR: El periodo Average True Range a utilizar para la clasificación de la pendiente.
- Período de EMA rápida [SÓLO PARA MA ADAPTATIVO]: El periodo de la EMA rápida en el cálculo de la Media Móvil Adaptativa. Esta entrada sólo se utiliza si se ha seleccionado 'Media Móvil Adaptativa' como Método MA. En caso contrario, esta entrada es irrelevante.
- Periodo de la EMA lenta [SÓLO PARA MA ADAPTATIVA]: El periodo de la EMA lenta en el cálculo de la Media Móvil Adaptativa. Esta entrada sólo se utiliza si se ha seleccionado "Media Móvil Adaptativa" como Método MA. En caso contrario, esta entrada es irrelevante.
- Periodo CMO [SÓLO PARA VIDYA]: El periodo del Oscilador de Momento Chande (CMO) utilizado en el cálculo de la Media Dinámica de Índice Variable. Esta entrada sólo se utiliza si se ha seleccionado "Media Dinámica de Índice Variable" como Método MA. De lo contrario, esta entrada es irrelevante.
Para desarrolladores de EA
- Fast MA Color: Buffer = 1
- Verde = 0
- Rojo = 1
- Azul = 2
- MA Lento Color: Buffer = 3
- Verde = 0
- Rojo = 1
- Azul = 2
- Líneas Verticales' Color: Buffer = 6
- Verde = 0
- Rojo = 1
- Azul = 2
- Longitud de las líneas verticales (puntos): Buffer = 7