Dashboard SAR
- Indicadores
-
Wang Yu
 Providing quick Developments and Conversion of MT4/MT5 EAs, Indicators, Scripts, and Tools. If you are looking for an Dashboard EA to turn your trading strategy into auto trading algo and to manage multi trades in one chart with visualizing tool, come and visit http://www.ex4gzs.com/en for more
 - Versión: 1.1
- Actualizado: 25 noviembre 2021
- Activaciones: 5
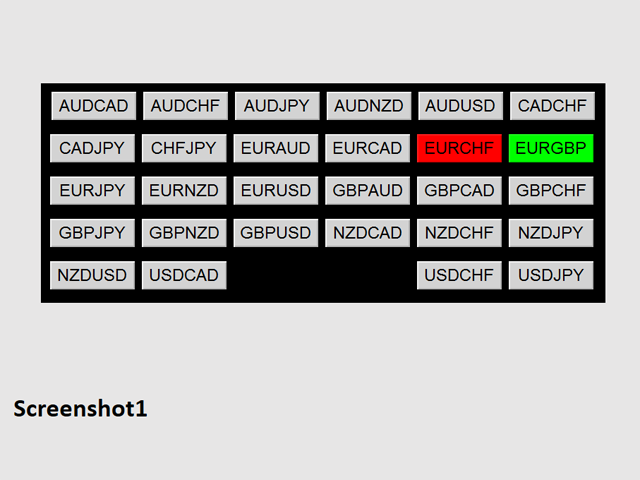
Este indicador ayuda a visualizar el estado del SAR de 28 pares. Con la función de panel de color, alerta, y las características de notificación, el usuario puede captar la compra potencial y vender oportunidades cuando los 28 principales pares de SAR puntos están cambiando entre la parte superior / inferior de las velas en un tablero de instrumentos rápidamente.
Dashboard SAR es una herramienta gráfica intuitiva y práctica para ayudarle a supervisar los 28 pares y proporcionar señales de trading basadas en las Reglas SAR (los puntos SAR están cambiando entre la parte superior/inferior de las velas).
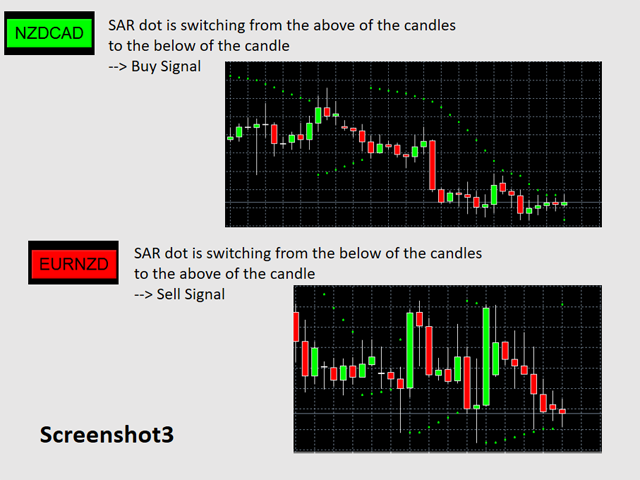
LEYENDA DE COLORES:
- clrRojo: El punto SAR cambia de la parte inferior de la vela a la parte superior de la vela.
- Se envía señal de venta
- clrLima: El punto SAR cambia de la parte superior de la vela a la parte inferior de la vela.
- Se envía señal de compra
Consulte la captura de pantalla 3
ACCIONES IMPORTANTES ANTES DE UTILIZAR EL PANEL DE CONTROL
- La primera vez que cargue el panel, la descarga de los datos históricos puede tardar entre 3 y 5 minutos. Para cargas posteriores, sólo tarda unos segundos.
- Asegúrese de tener los 28 símbolos en la ventana de Símbolos.
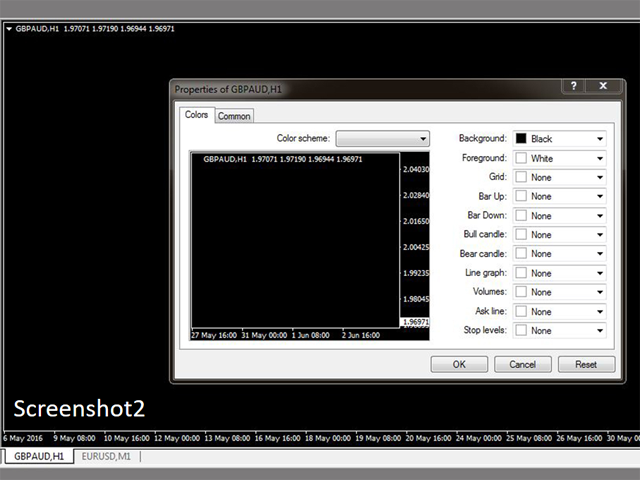
- Para que su cuadro de mandos tenga un aspecto claro y ordenado, es mejor aplicar la plantilla negra. Consulte la captura de pantalla 2.
PARÁMETROS DE ENTRADA
- Enviar Alerta tras Señal
- Enviar Notificación en caso de Señal
- Periodo de SAR
- Paso del SAR
- Valor máximo del paso del SAR
- TimeFrame del nuevo gráfico
- string usertemplate = "default"
- sufijo: cadena de sufijo de su símbolo. es decir: su símbolo es 'EURUSDx' en lugar de 'EURUSD', introduzca 'x' en la celda de sufijo, deje la celda de prefijo en blanco
- prefijo: cadena del prefijo de su símbolo
- eje_x: posición x del cuadro de mandos
- eje_y: posición y del cuadro de mandos
OBJETOS DEL CUADRO DE MANDOS
Consulte las capturas de pantalla 1 y 3.
NOTAS
Una vez enviada la alerta/notificación de un par concreto, la siguiente alerta/notificación de ese par se enviará durante los 5 minutos siguientes a la señal.