Dashboard Super Critical Support and Resistance
- Indicadores
-
Wang Yu
 Providing quick Developments and Conversion of MT4/MT5 EAs, Indicators, Scripts, and Tools. If you are looking for an Dashboard EA to turn your trading strategy into auto trading algo and to manage multi trades in one chart with visualizing tool, come and visit http://www.ex4gzs.com/en for more
 - Versión: 1.3
- Actualizado: 21 noviembre 2021
- Activaciones: 5
如果产品有任何问题或者您需要在此产品上添加功能,请联系我
Ponte en contacto conmigo/mándame un mensaje si tienes algún problema al utilizar el producto o si necesitas alguna función adicional que añadir a la versión base.
Para acceder a la versión demo gratuita, por favor rediríjase a este ENLACE.
Para acceder a la versión single pair, por favor diríjase a este ENLACE.
Es probable que el precio retroceda o rompa en soportes y/o resistencias importantes. Este panel de control está diseñado para ayudarle a controlar estas áreas críticas de soporte y resistencia. Una vez que el precio se mueva cerca de estos importantes soportes y resistencias dentro del área de advertencia (el rango del área de advertencia es ajustable), se enviará una alerta o notificación, y el panel del indicador se pintará de rojo para hacerlo más visible. De este modo, no tendrá que estar pendiente de los gráficos durante todo el día.
Dashboard Super Critical Support and Resistance es una herramienta gráfica intuitiva y práctica que le ayudará a..:
- Tener bajo control los soportes y resistencias críticos más utilizados (soporte pivote1/2/3, resistencia pivote1/2/3, pivote diario/semanal/mensual, apertura diaria, punto redondo 100, y máximo/mínimo diario anterior) de 28 pares principales con un panel de control.
Características
- Posibilidad de seleccionar el uso de la función de alerta/notificación.
- Rango de alerta ajustable para cada tipo de soporte/resistencia crítico.
- Posibilidad de seleccionar qué soporte/resistencia crítica utilizar, por defecto, todas están seleccionadas.
- Posición ajustable del panel indicador.
Parámetros de entrada
- Enviar alerta tras señal (Consulte la nota1)
- Verdadero: enviar alerta una vez que el precio se mueva al área dentro de la zona de advertencia
- Falso: no se enviará ninguna alerta
- Enviar notificación tras señal (Ver nota 1)
- Igual que Enviar Alerta
- Usar Soporte Pivote1
- Verdadero: el panel de celdas de soporte pivote se pintará de rojo y se enviará una alerta/notificación cuando el precio se mueva dentro de la zona de advertencia de soporte pivote.
- Falso: no se activará ninguna acción
- La misma regla se aplica a los siguientes soportes/resistencias
- Zona de advertencia del soporte pivote1
- Verdadero: el panel de celdas de soporte pivote se pintará de rojo y se enviará una alerta/notificación cuando el precio se mueva dentro de la zona de advertencia de soporte pivote.
- La misma regla se aplica a la siguiente zona de advertencia
- Utilizar Soporte Pivote2
- Zona de Advertencia de Soporte Pivote2
- Utilizar soporte pivote3
- Pivote Soporte3 Zona de Advertencia
- Utilizar Pivote Resistencia1
- Pivote Resistencia1 Zona de Advertencia
- Usar Pivote Resistencia2
- Pivote Resistencia2 Zona de Advertencia
- Utilizar Pivote Resistencia3
- Pivote Resistencia3 Zona de Advertencia
- Usar Pivote Diario
- Pivote diario Zona de advertencia
- Usar Pivote Semanal
- Pivote Semanal Zona de Advertencia
- Usar Pivote Mensual
- Pivote mensual Zona de advertencia
- Usar Apertura Diaria
- Zona de Advertencia de Apertura Diaria
- Utilizar Punto Redondo 100
- Zona de advertencia de 100 puntos redondos
- Utilizar máximo diario anterior
- Máximo diario anterior Zona de advertencia
- Utilizar mínimo diario anterior
- Zona de advertencia de mínimos diarios anteriores
- Sufijo: cadena del sufijo de su símbolo. Por ejemplo: su símbolo es "EURUSDx" en lugar de "EURUSD", introduzca "x" en la celda del sufijo, deje la celda del prefijo en blanco.
- Prefijo: cadena del prefijo de su símbolo
- Eje_X: posición x del cuadro de mandos
- Eje_Y: posición x del cuadro de mandos
Objetos del cuadro de mandos
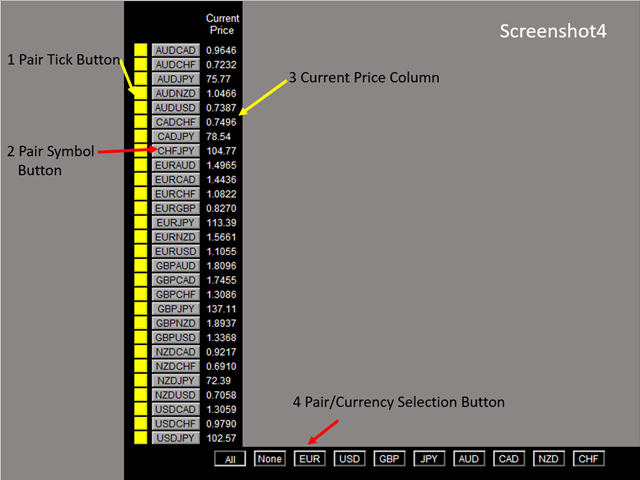
Para el objeto 1-12 captura de pantalla4-8
- Botón Pair Tick: Haga clic una vez para activar el par correspondiente para la negociación. Haga clic una vez más para desactivarlo.
- Botón de símbolo de par:
- Haga clic en el botón para abrir el gráfico correspondiente en una nueva ventana.
- Columna Precio Actual: muestra el precio actual de cada par.
- Botón de Selección de Par/Divisa:
- Todos: selecciona los 28 pares
- Ninguno: borra todos los pares seleccionados
- EUR: selecciona todos los pares EUR, como EURUSD, EURJPY...
- Las mismas reglas se aplican a los botones USD, GBP, JPY...
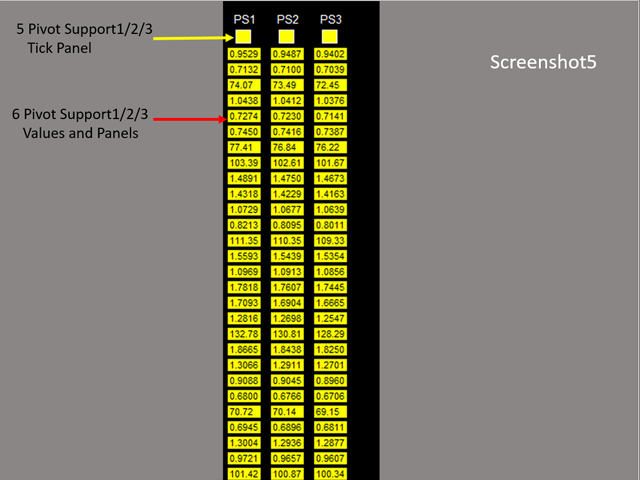
- Pivot Support1/2/3 Tick Panel
- Pivote Soporte1/2/3 Valores y Paneles
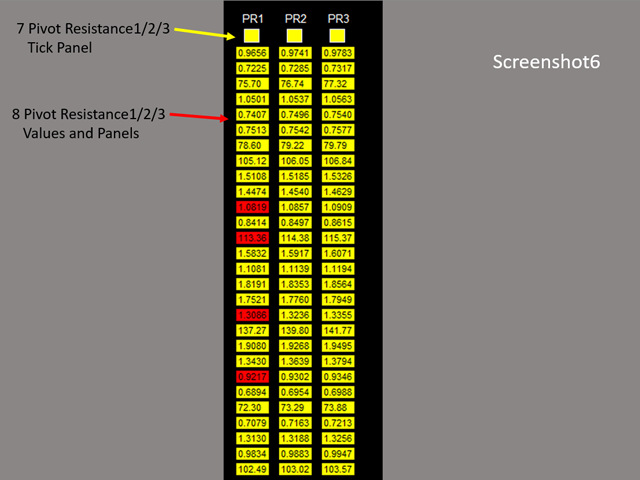
- Pivote Resistencia1/2/3 Tick Panel
- Pivote Resistencia1/2/3 Valores y Paneles
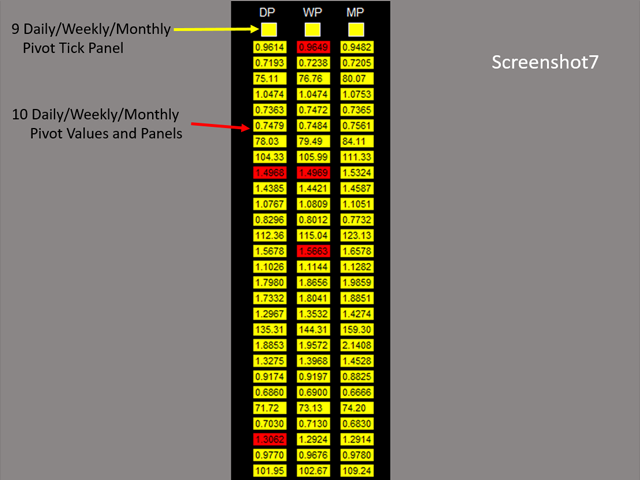
- Diario/Semanal/Mensual Pivote Tick Panel
- Diario/Semanal/Mensual Pivote Valores y Paneles
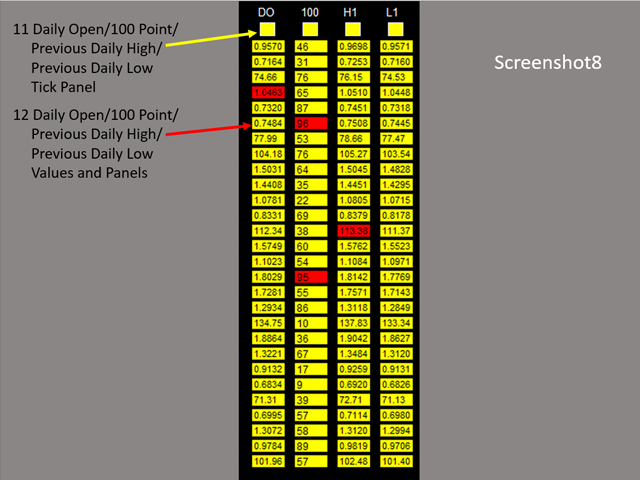
- Apertura diaria/100 puntos/Anterior máximo diario/Anterior mínimo diario Panel de ticks
- Apertura diaria/100 puntos/Anterior máximo diario/Anterior mínimo diario Valores y paneles
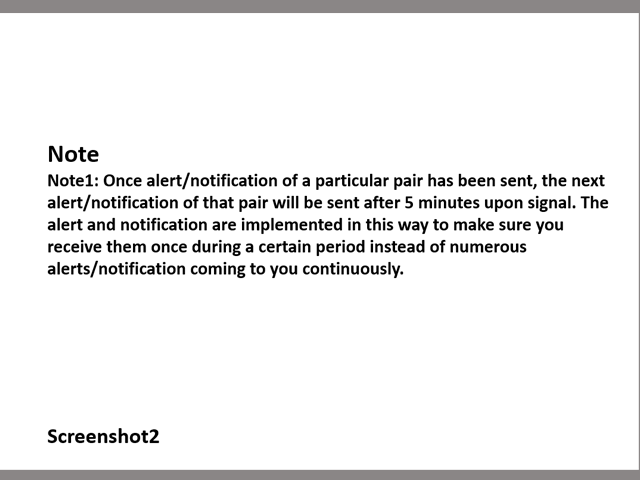
Nota
Consulte la captura de pantalla 2
Si usted tiene alguna solicitud personalizada y / o sugerencia, por favor retroalimentación para mí.


Helps you find trades at the right place and time. Very easy to pull up the anyone of the 28 pairs listed. It's a must have for anyone looking to trade multiple currency pairs, and using pivot points for their trading.