DeMarker Alerts MT5
- Indicadores
- Versión: 1.1
- Actualizado: 26 noviembre 2021
- Activaciones: 20

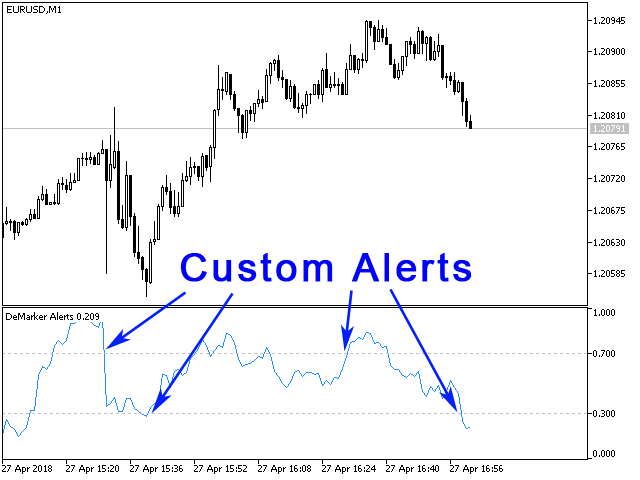
Puede evitar la monitorización constante de la pantalla del ordenador a la espera de la señal DeMarker mientras recibe notificaciones push a un terminal móvil o una alerta sonora en la pantalla sobre todos los eventos necesarios, utilizando este indicador - DeMarker Alerts. De hecho, es la sustitución del indicador estándar con el que nunca se perderá las señales del oscilador.
Si usted no sabe los beneficios de DeMarker o cómo usarlo, por favor lea aquí. Si necesita señales de un indicador RSI más popular, utilice RSI Alerts. Si necesita la versión para MetaTrader 4, vea DeMarker Alerts.
Eventos soportados actualmente
- Indicador cruzando hacia abajo el nivel de señal superior (por defecto es 0,7) - una señal de venta.
- Indicador que cruza hacia arriba el nivel de señal superior (por defecto es 0,7) - una señal de compra, o mejor esperar.
- Indicador que cruza hacia abajo el nivel de señal inferior (por defecto es 0,3) - una señal de compra, o mejor esperar.
- Indicador que cruza hacia arriba el nivel de señal inferior (por defecto es 0,3) - una señal de compra.
También puede editar los valores de estos niveles utilizando el botón Nivel máximo de señal y Nivel de señal mínimo variables.
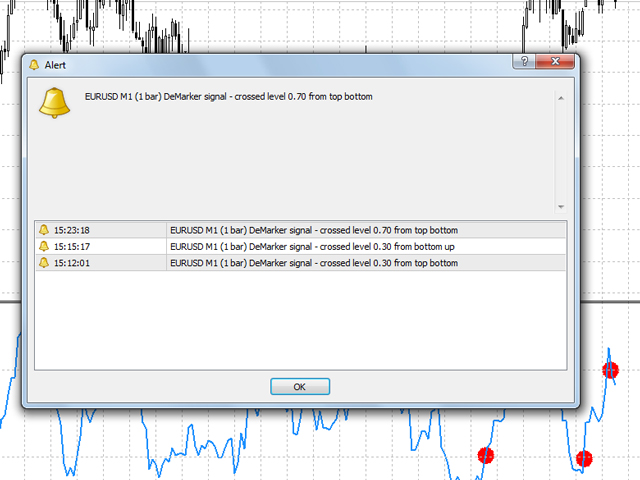
Alertas disponibles
- Señal sonora con un cuadro de mensaje emergente - Alerta.
- Notificación push a un terminal móvil (smartphones y tablets) - Push.
Si desea activar las notificaciones push con las señales DeMarker, debe indicar MetaQuotes ID(cómo hacerlo).
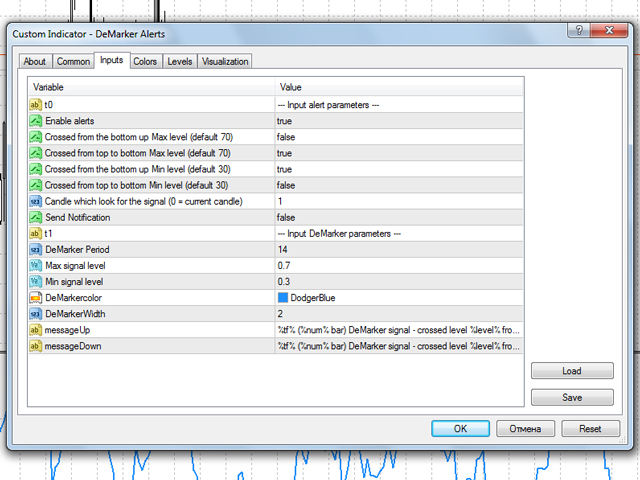
Parámetros del indicador
- Habilitar alertas - permitir alertas sonoras y visualización de mensajes en pantalla.
- Cruzadode abajo haciaarriba Nivel Max(por defecto 0.7) - habilitar alerta para el indicador que cruza el nivel de señal Max de abajo hacia arriba
- Cruzado de arriba aabajo Nivel máximo(por defecto 0.7) - habilita la alerta para el indicador que cruza el nivel de señal máximo de arriba a abajo.
- Cruzado de abajohacia arriba Nivel mínimo(por defecto 0,3) - activar la alerta para el indicador que cruza Nivel mínimo de señal de abajo hacia arriba
- Cruzado dearriba a abajo Nivel mínimo (por defecto 0.3) - activa la alerta para el indicador que cruza Nivel de señal mínimo de arriba a abajo
- Vela enla que se busca la señal (0 = vela actual) - el número de la vela en la que se utiliza la señal (0 - vela actual, 1 - anterior).
- Enviar Notificación - permite enviar notificaciones Push a su terminal móvil.
- DeMarker Period - periodo del indicador DeMarker
- Max signal level - nivel de señal superior
- Min signal level - nivel de señal inferior
- DeMarkercolor - color del indicador
- DeMarkerWidth - ancho de la línea del indicador
- messageUp - plantilla de mensaje para cruce ascendente
- messageDown - plantilla de mensaje para cruce descendente
También es posible cambiar el texto del mensaje. En las variables messageUp y messageDown:
- %level% significa el nivel cruzado por el indicador
- %tf% significa el marco temporal desde el que se recibe la señal.
- %num% significa el número de la vela desde la que se recibe la señal.
Si este indicador carece de la funcionalidad que desea, sea bienvenido a escribirme.