Delta CCi MTF7
- Indicadores
- Versión: 1.2
- Actualizado: 25 noviembre 2021
- Activaciones: 20

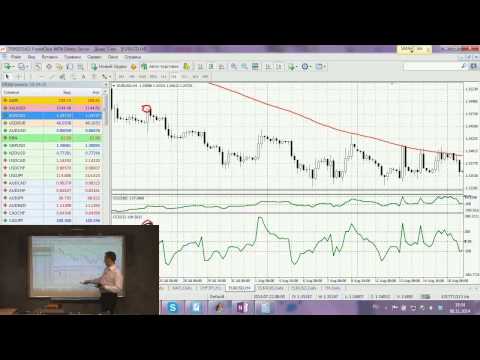
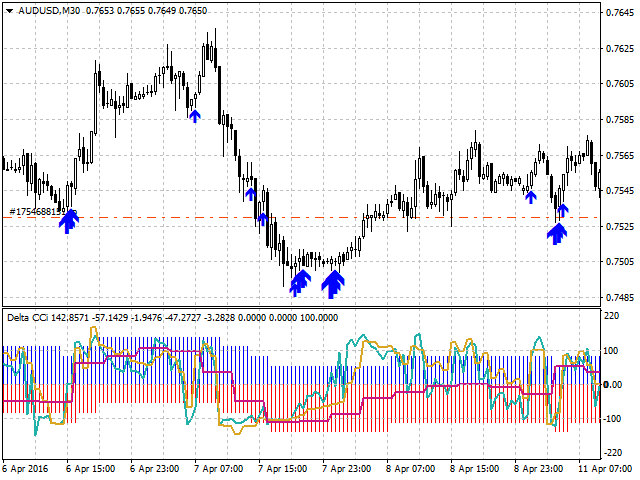
Para operar correctamente con indicadores CCI es necesario que el operador controle varios marcos temporales e indicadores CCI con diferentes periodos. Por ejemplo - monitorear la tendencia utilizando CCI con el período de 100 o 200(período lento CCI) en el marco de tiempo H4, y hacer entradas basadas en el CCI con el período de 13(período rápido CCI) en el marco de tiempo H1. Para facilitar esta tarea, se creó el indicador Delta CCi MTF7, que implementa el seguimiento de los cambios de las tendencias de movimiento de los precios, así como marca las entradas con flechas para cada marco de tiempo. Para aquellos que no saben cómo operar utilizando el CCI, vea el vídeo adjunto.
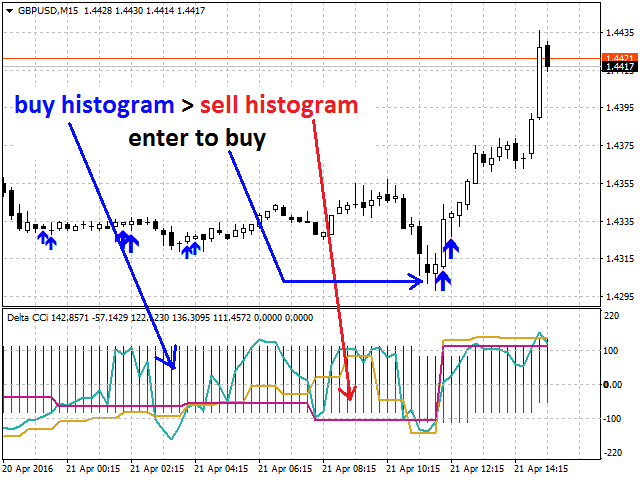
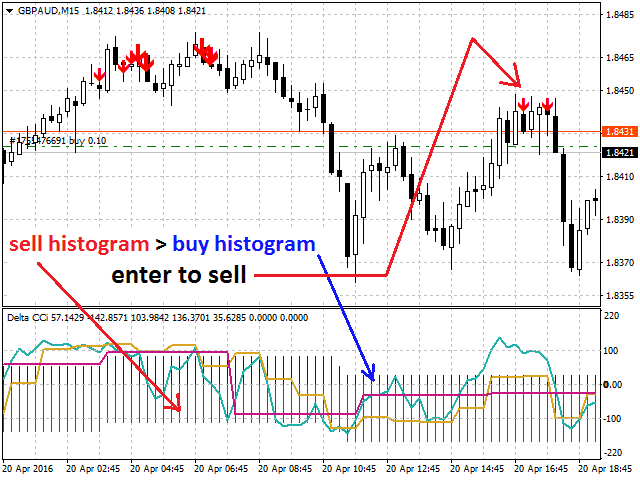
El indicador recoge datos sobre el CCI de siete marcos temporales - М5, М15, М30, М60, H1, H4, D1, W1. También permite mostrar las líneas de tres indicadores CCI de tres marcos temporales seleccionados y la tendencia general de la divisa en una ventana como histograma. La tendencia como histograma muestra la suma de todas las tendencias positivas y negativas de los 7 marcos temporales, es decir, si la tendencia en el tercer marco temporal está en la Compra, y en el cuarto marco temporal está en la Venta, el histograma será ligeramente más largo en la Venta (barras rojas) que en la Compra (barras azules). En consecuencia, cuanto mayor sea la preponderancia de uno de los histogramas - mayor será la preponderancia de la tendencia en esa dirección.
Por defecto, el indicador está configurado para el trading clásico(Filtro de tendencia = filtro duro) - trading basado en la tendencia del timeframe H4, con entradas por timeframes menores.
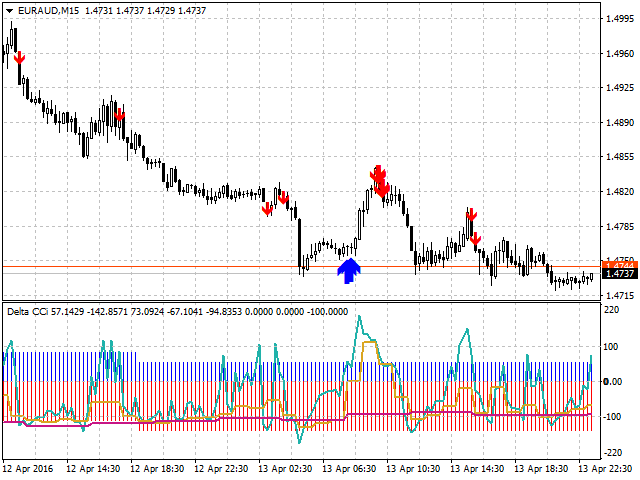
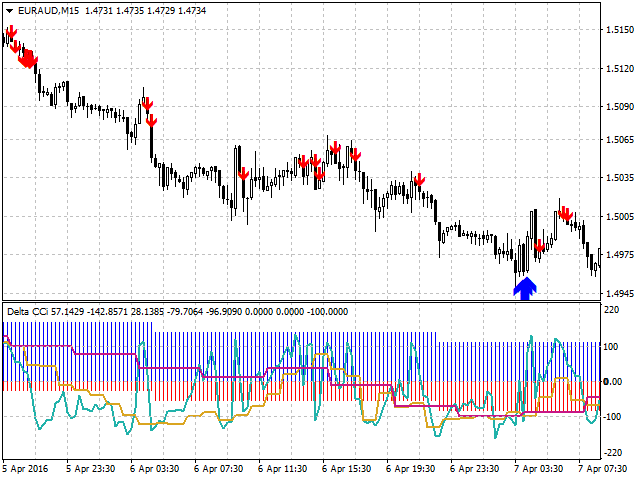
Si es necesario, el filtro de tendencia se puede desactivar(Filtro de tendencia= filtro desactivado). En ese caso, se mostrarán todas las entradas de los indicadores CCI de todos los marcos temporales.
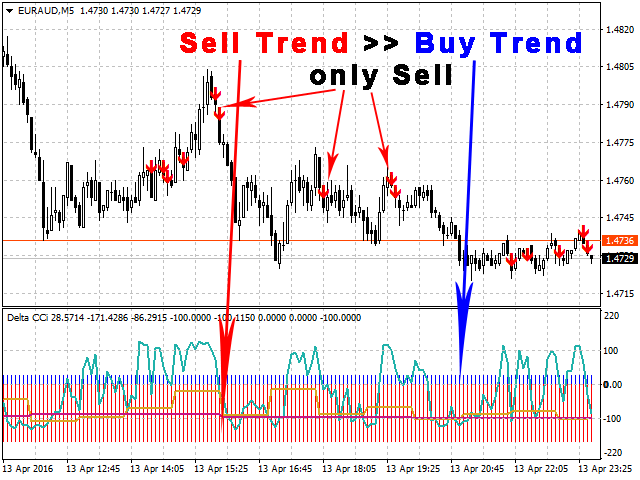
También existe un filtro por la tendencia dominante, resumida de todos los plazos -(Filtro de tendencia= filtro medio). Si el histograma dominante es azul (compra) sólo se mostrarán las entradas de compra, si el histograma dominante es rojo (venta) sólo se mostrarán las entradas de venta.
El marco de tiempo recomendado para el indicador: de М5 a H4. No se recomienda establecerlo más alto, ya que habrá una necesidad de volver a calcular demasiada historia en los siete marcos de tiempo.
Parámetros del indicador
- Período del CCI rápido(1-2-3) - período del CCI rápido, para señales de entrada, el valor por defecto es 13.
- Período del CCI lento, filtro - período del CCI lento, para determinar tendencias, el valor por defecto es 200 (debe ser mayor que 50).
- Bars limit - el límite en el número de velas, el cálculo de los datos de 7 timeframes puede cargar la CPU, el valor por defecto es 300 velas.
- Tipo de gráfico - tipo de gráfico de tendencia
- Histograma - histograma de compra y venta.
- MA - línea que muestra la suma de CCI de los 7 timeframes, si es menor que 0 - vender, si es mayor que 0 - comprar.
- Histograma Delta - diferencia de los histogramas (muestra sólo la diferencia entre el histograma de Compra y Venta).
- CCITF 1 - timeframe de la primera línea CCI dibujada, si no se especifica, entonces el timeframe actual.
- CCI TF 2 - timeframe de la segunda línea CCI dibujada, por defecto - H1.
- CCI TF 3 - timeframe de la tercera línea CCI dibujada, por defecto - H4.
- Dibujar flechas - dibujar las flechas
- Arrow Alerts - utilizar señal sonora cuando aparecen las entradas.
- Trend filter - filtro de tendencia.
- filtro desactivado - desactivar el filtro, se mostrarán todas las entradas CCI para todos los plazos.
- filtromedio - filtrado por la tendencia dominante de todos los plazos.
- hard filter - filtro de tendencia H4 (trading clásico), está seleccionado por defecto.
- Sell arrow color - color de las flechas de venta.
- Buy arrow color - color de las flechas de compra
- Color C CITF1 - color de la línea del indicador CCI con el período TF1
- Color C CI TF2 - color de la línea del indicador CCI con el período TF2
- Color C CITF3 - color de la línea del indicador CCI con el período TF3
- Colorhistograma de venta - color del histograma de venta
- Colorhistograma de compra - color del histograma de compra
- Color gráfico tipo MA - color de la línea del indicador, si se selecciona el modo de gráfico MA
Valores del buffer
- 0 - valor del Histograma +
- 1 - valor de Histograma -
- 2 - valor de CCI con período 1
- 3 - valor de CCI con período 2
- 4 - valor del CCI en el período 3
- 5 - valor del CCI resumido cuando se muestra como Media Móvil
- 6 - flechas de compra
- 7 - flechas de venta
- 8 - valor del Histograma + diferencia
- 9 - valor del Histograma - diferencia


El usuario no ha dejado ningún comentario para su valoración