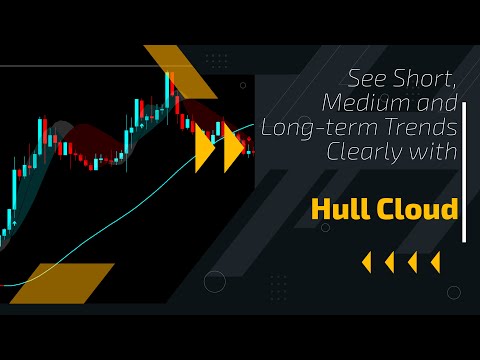
Hull Cloud
- Indicadores
-
Flavio Javier Jarabeck
 We are a closed brotherhood of traders whose ultimate goal is to profit through well-studied, structured, and automated trades. As a result, we publish dozens of MT5 indicators (FREE and paid) to the global MQL5 community. 80% of our published products are high-quality free indicators so beginner
 - Versión: 1.0
- Activaciones: 20
La media móvil de Hull es conocida por su capacidad para reducir el desfase y ofrecer una descripción más clara y precisa de las tendencias del mercado. Al suavizar los datos de precios de forma más eficaz que las medias móviles tradicionales, ayuda a los operadores a identificar las direcciones de las tendencias y los cambios de tendencia con mayor precisión.
El indicador Nube de Hull eleva esta precisión utilizando cuatro medias móviles de Hull que funcionan juntas como una orquesta. Esta combinación crea un sistema dinámico que destaca las tendencias a corto, medio y largo plazo, ofreciendo a los operadores una visión completa de los movimientos del mercado y de los posibles puntos de entrada.
¿Por qué debería interesarme la Nube de Hull?
La Nube de Cascos es una herramienta muy creativa para los operadores de tendencias. Su configuración única de múltiples medias móviles de Hull capta los movimientos de las tendencias desde su inicio, proporcionando una ventaja en un entorno de negociación de ritmo rápido. Al detectar estas tendencias a tiempo, los operadores pueden posicionarse ventajosamente y maximizar sus beneficios.
Con sus funciones avanzadas y sus ajustes personalizables, Hull Cloud se adapta a su estrategia de negociación, ofreciendo alertas oportunas y una visualización clara de las tendencias del mercado. Este indicador es esencial para los operadores que desean adelantarse al mercado y tomar decisiones de negociación informadas basadas en un análisis de tendencias fiable.
¿Cómo funciona la nube Hull?
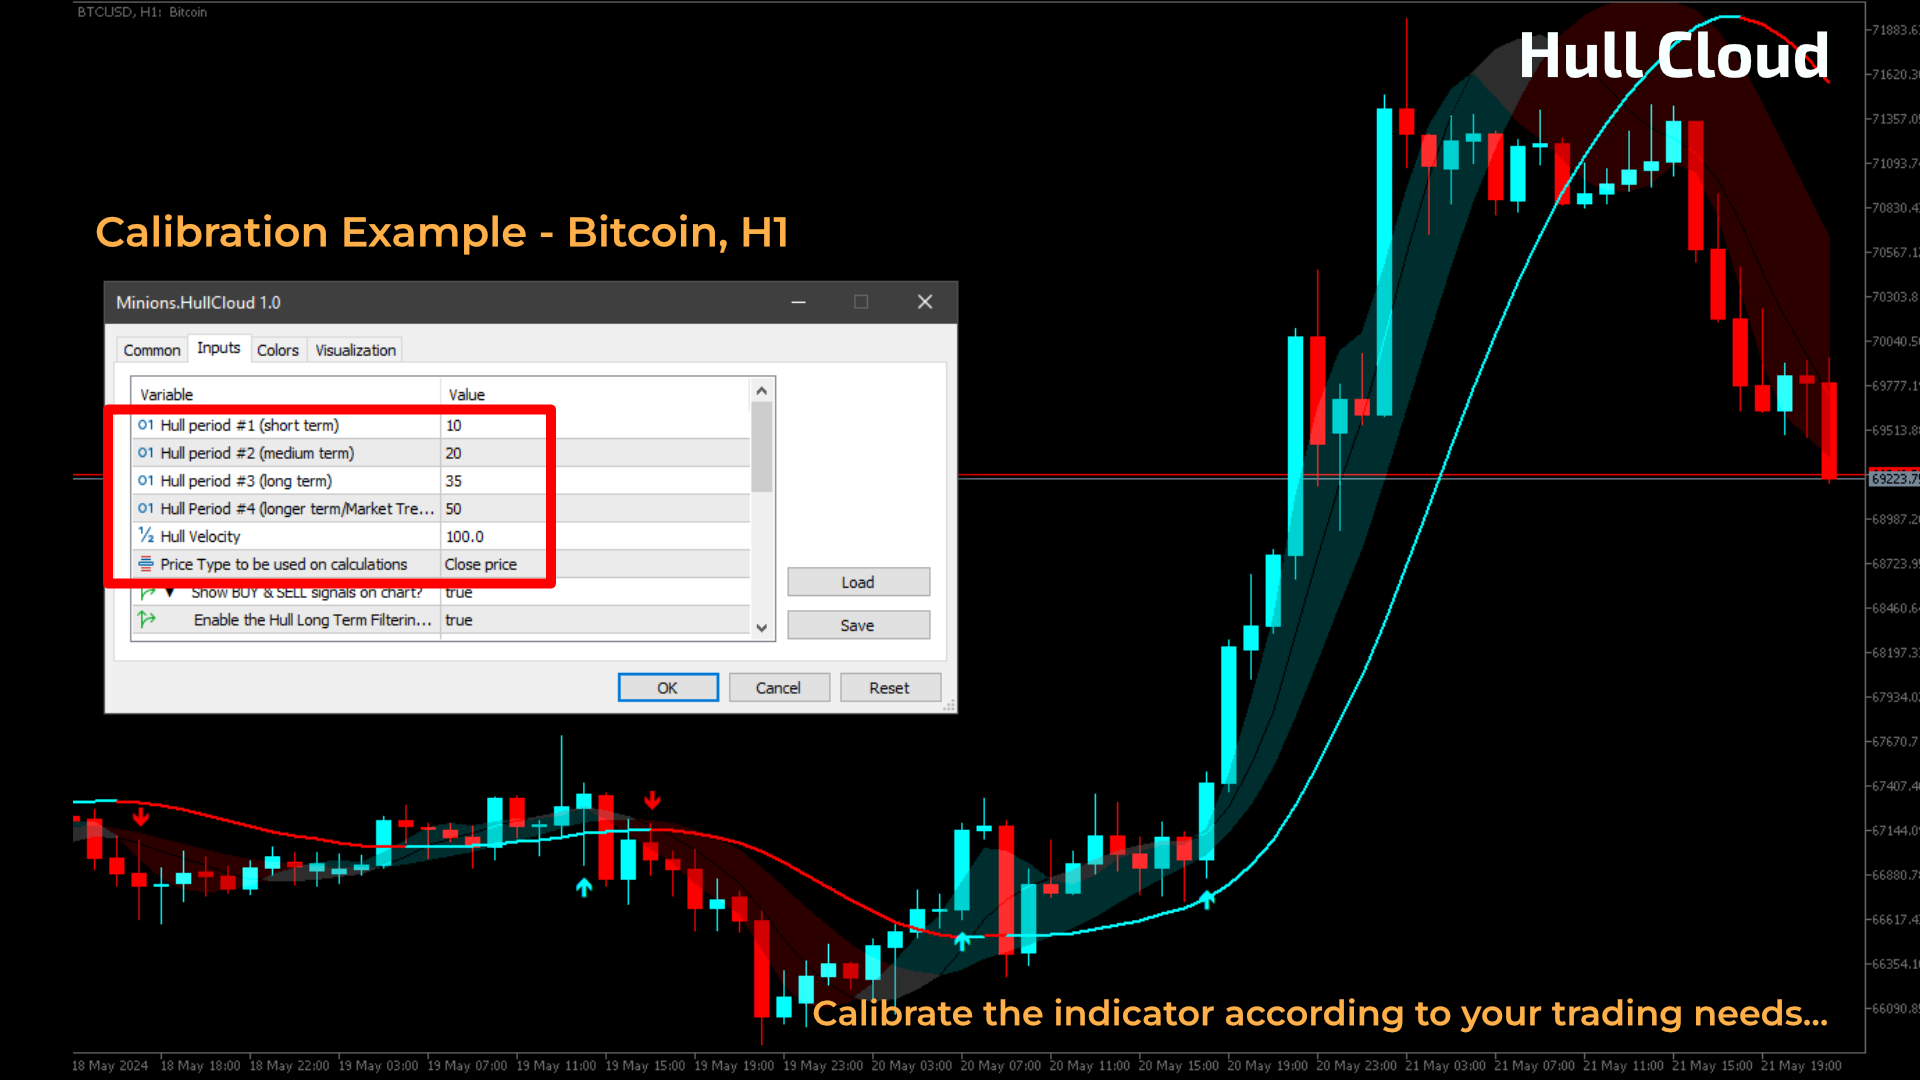
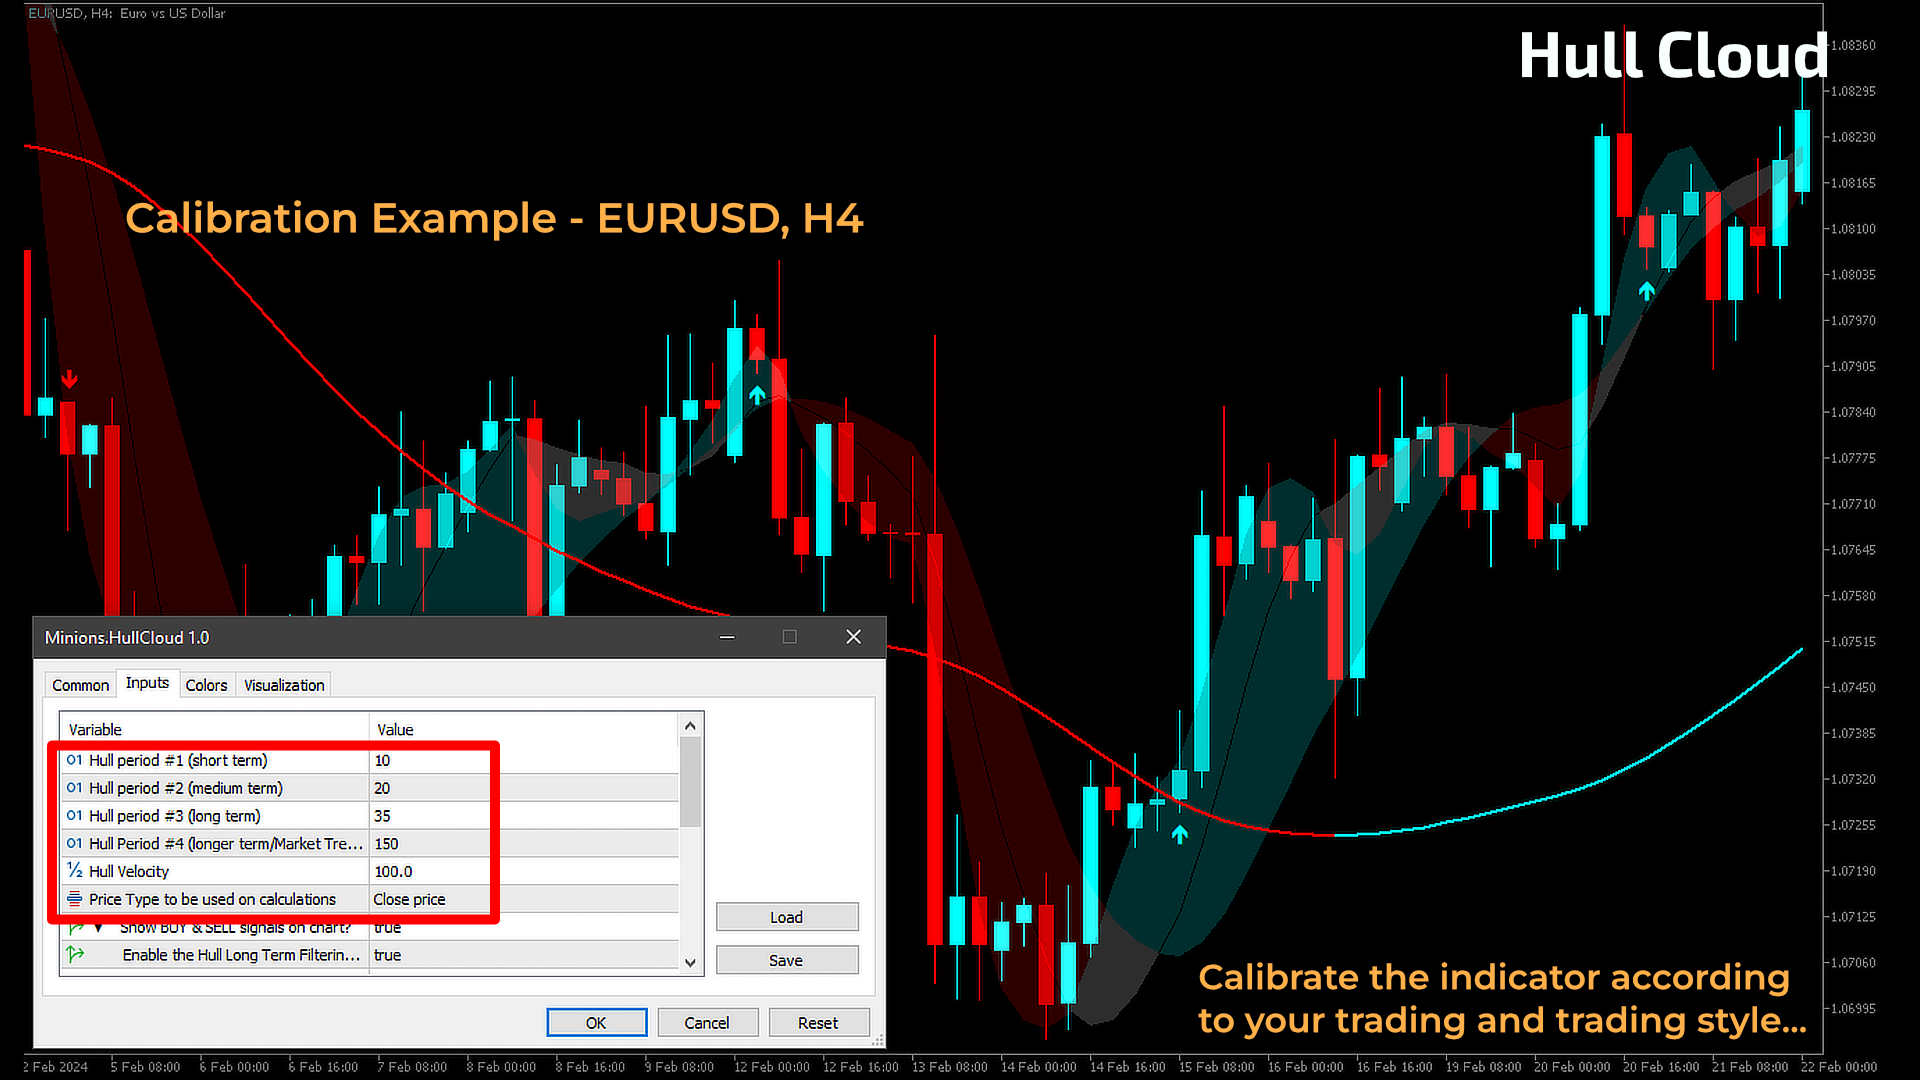
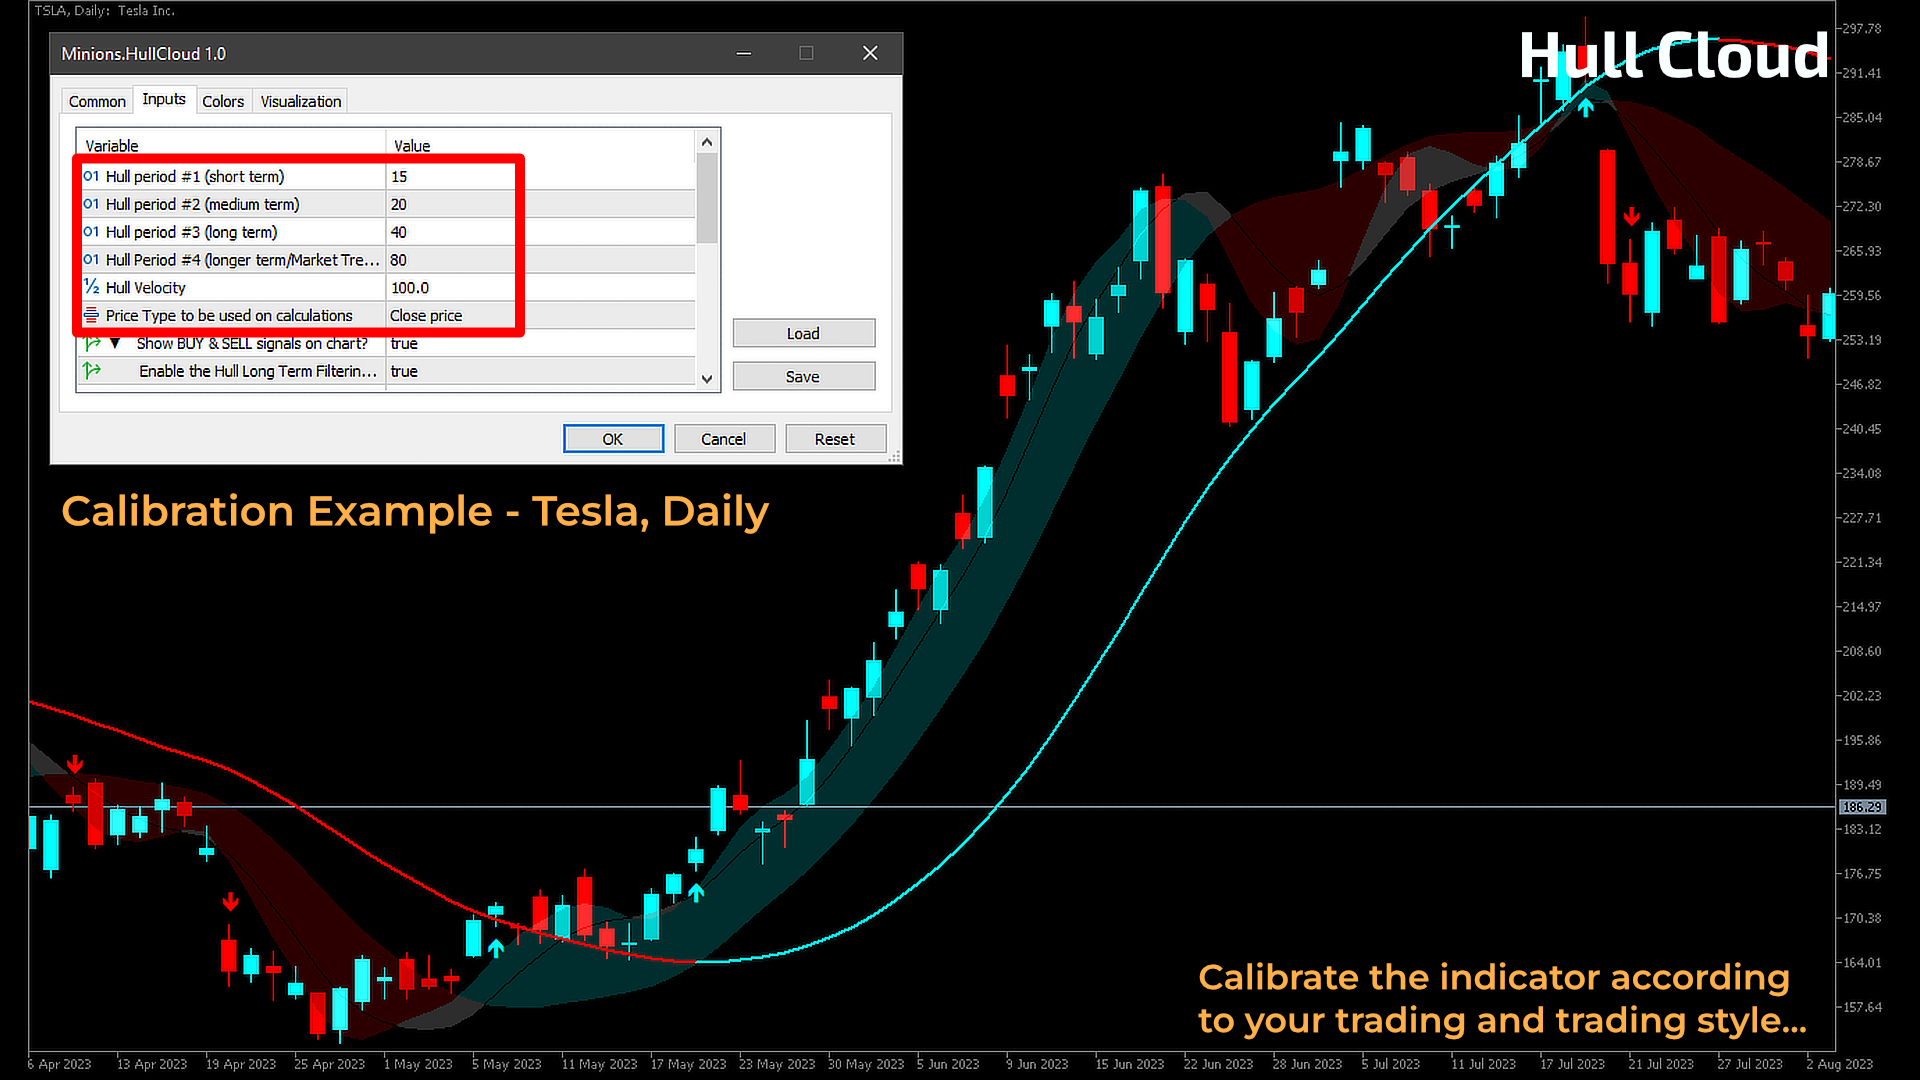
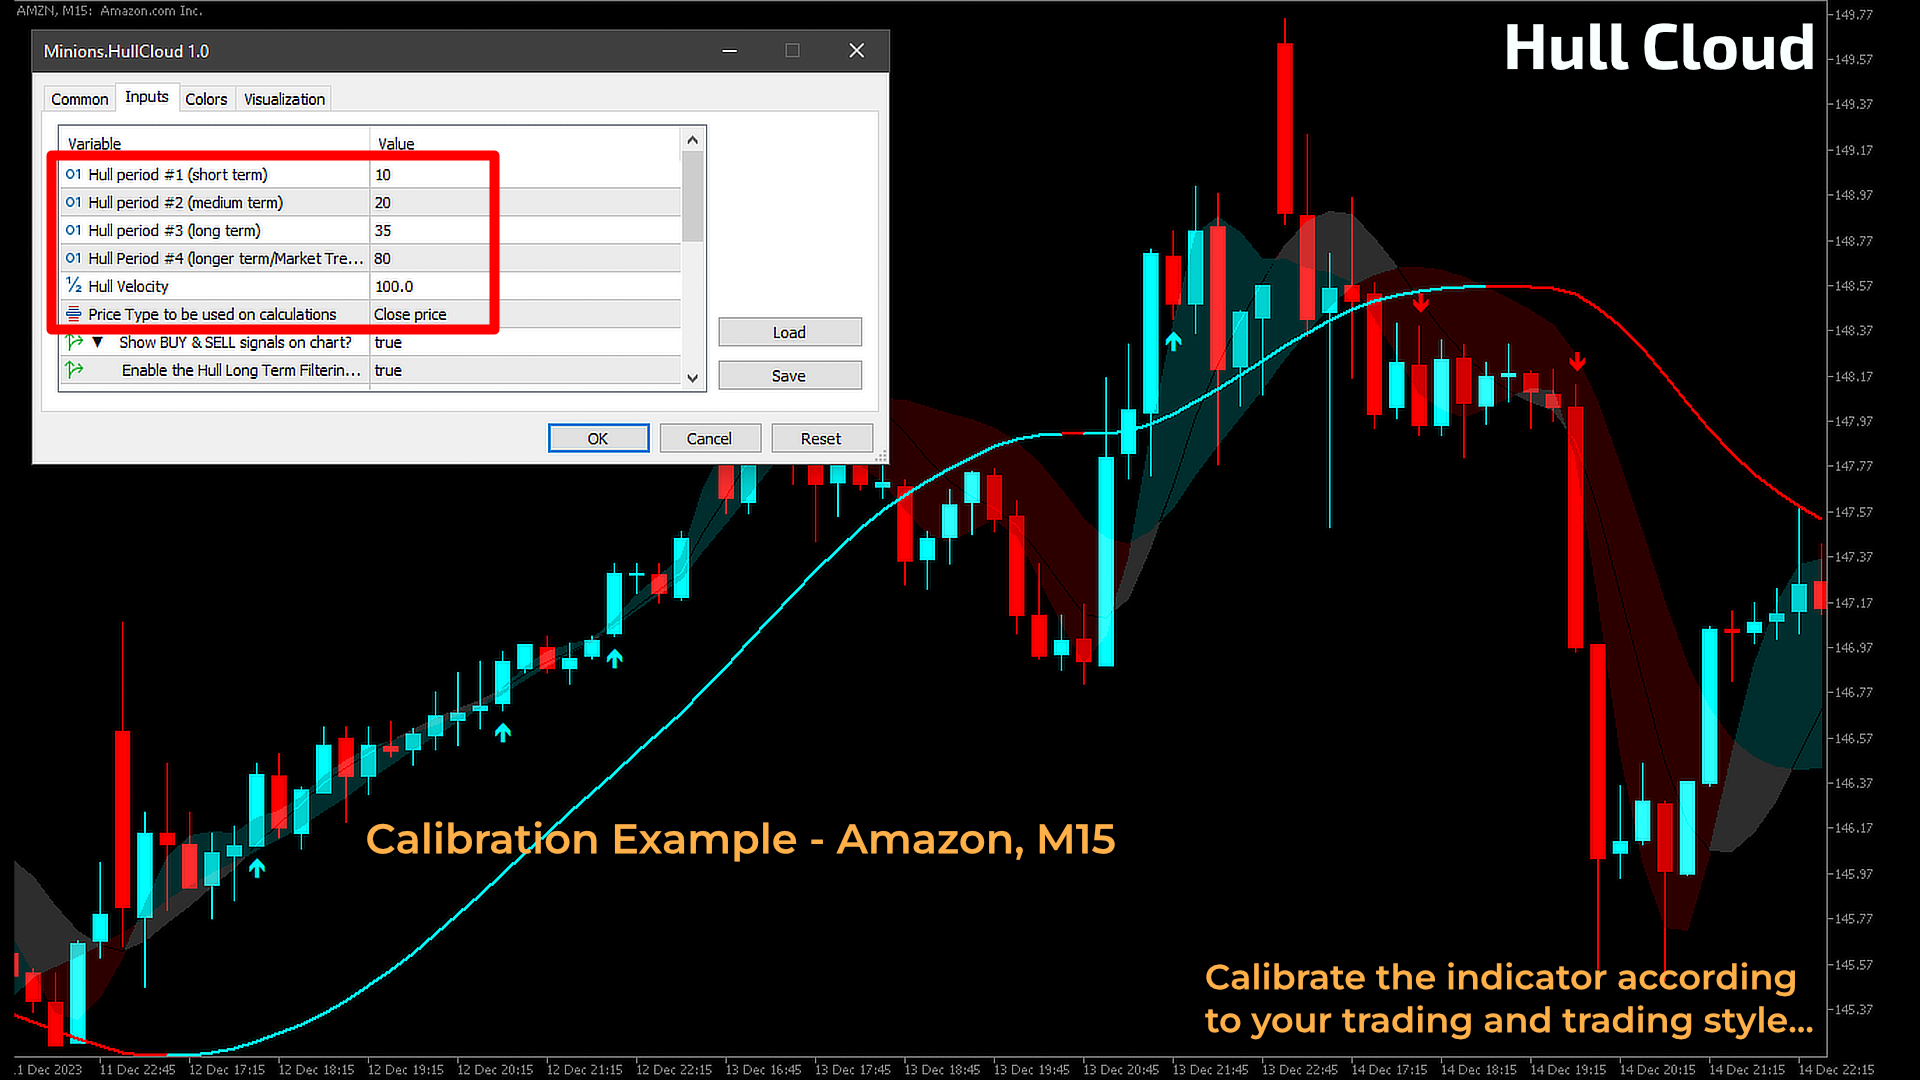
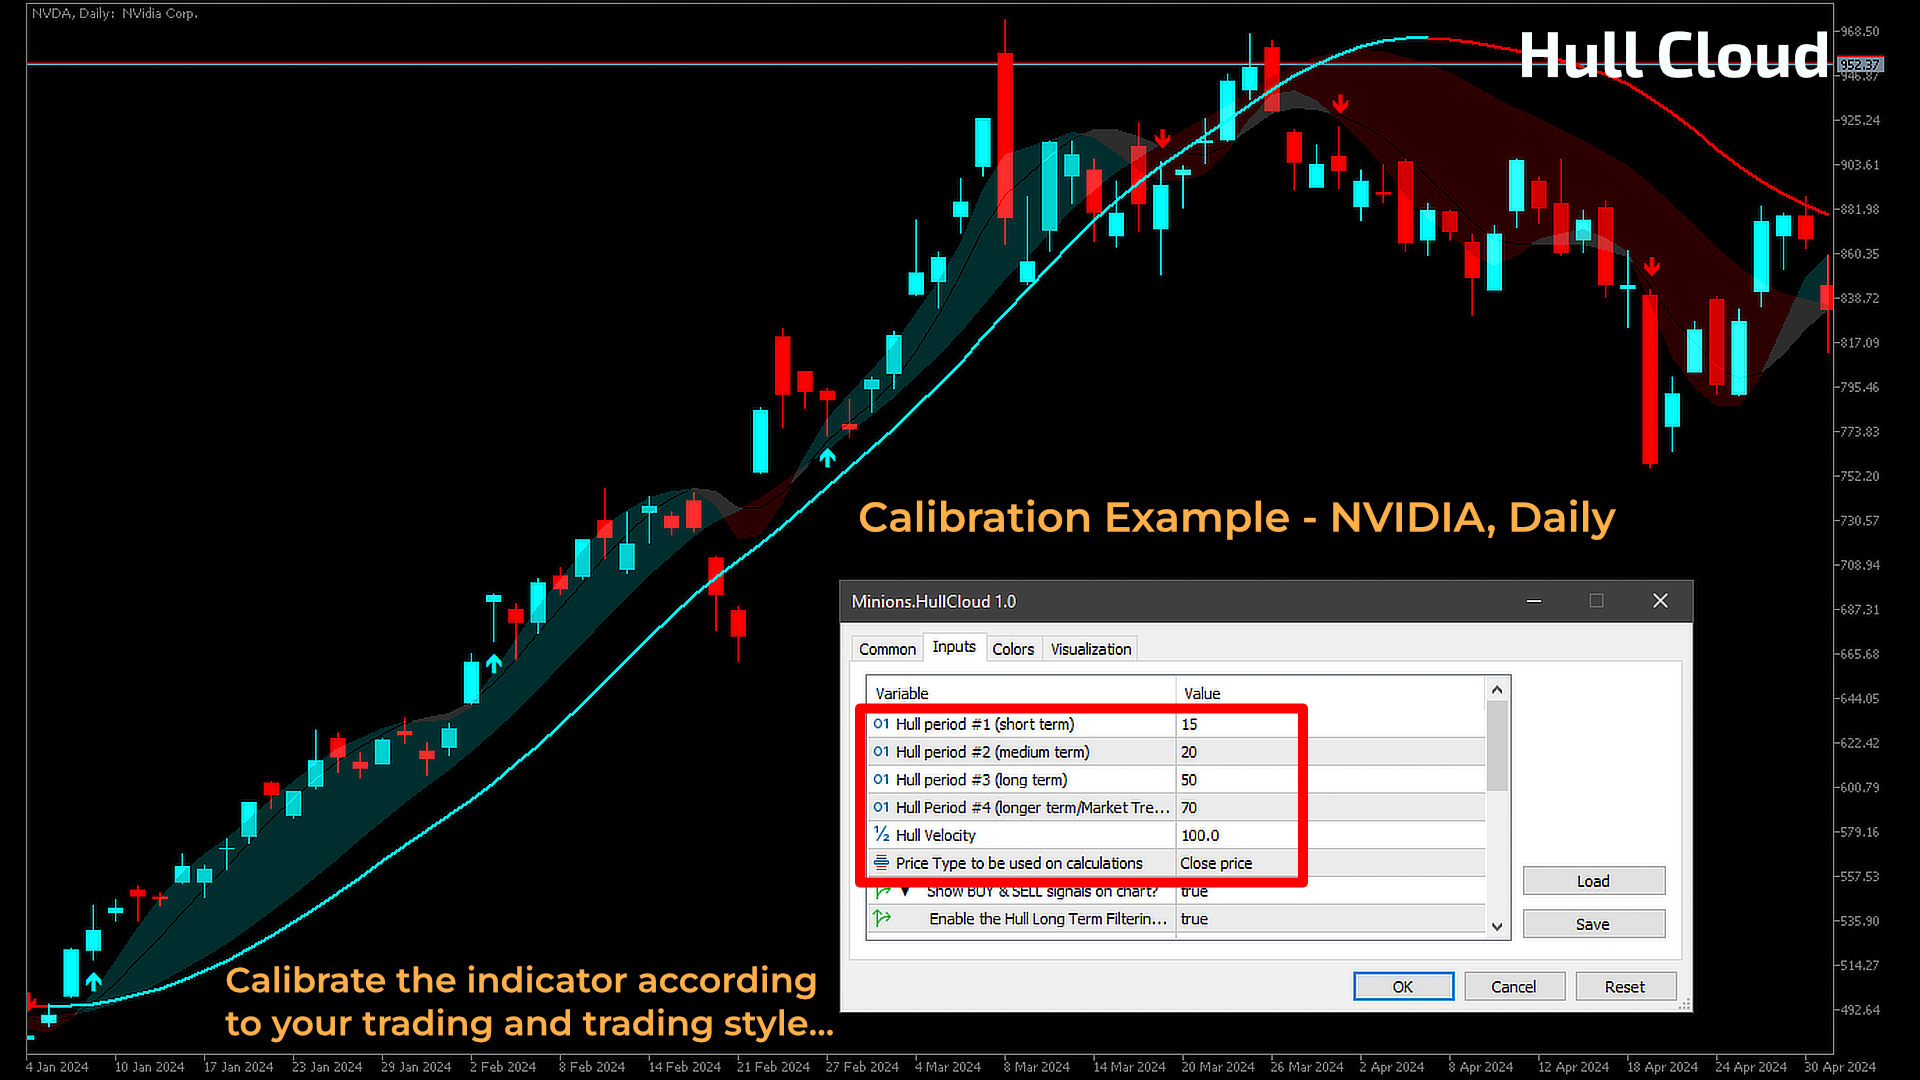
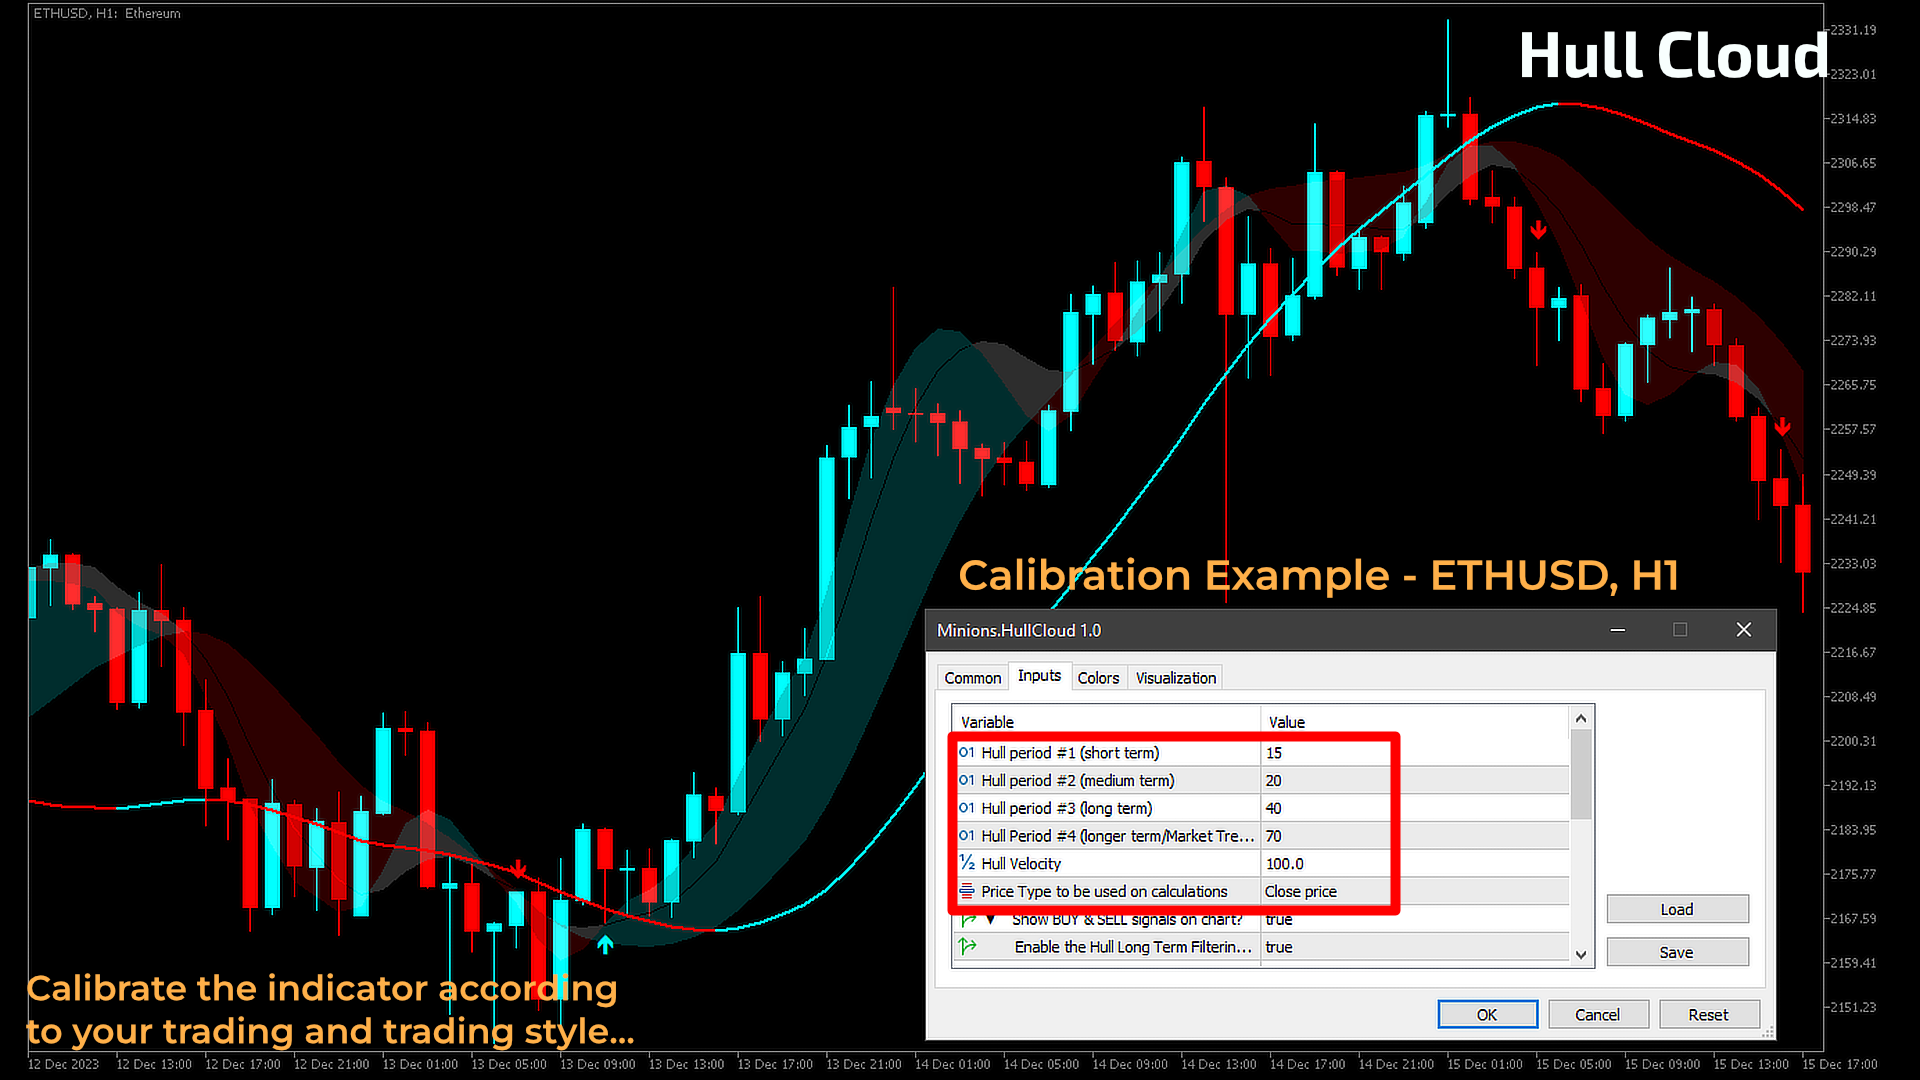
Tenemos dos Nubes de Cascos pintadas en el gráfico, que ofrecen al operador información sobre el impulso. La tercera media de Hull muestra la dirección de la tendencia global, una media de Hull de período alto que indica el impulso del mercado. Cuando se calibra correctamente, la Nube de Cascos proporciona una visión generosa de las tendencias a corto, medio y largo plazo, junto con alertas sobre los momentos adecuados para subirse a la tendencia. Aunque ningún indicador es el Santo Grial, conocer los puntos clave de soporte y resistencia y la tendencia general mejorará sus decisiones de inversión.
¿Cómo "leer" el indicador de la nube de Hull?
- Alineación de las tres Medias de Casco que constituyen las dos Nubes de color Casco que aparecen en el gráfico.
- Habilite las señales de COMPRA y VENTA para verlas claramente impresas en su gráfico.
- Además, active el sistema de alerta para recibir notificaciones a través de popups, correo electrónico, o la aplicación MT5 en una señal de COMPRA y VENTA.
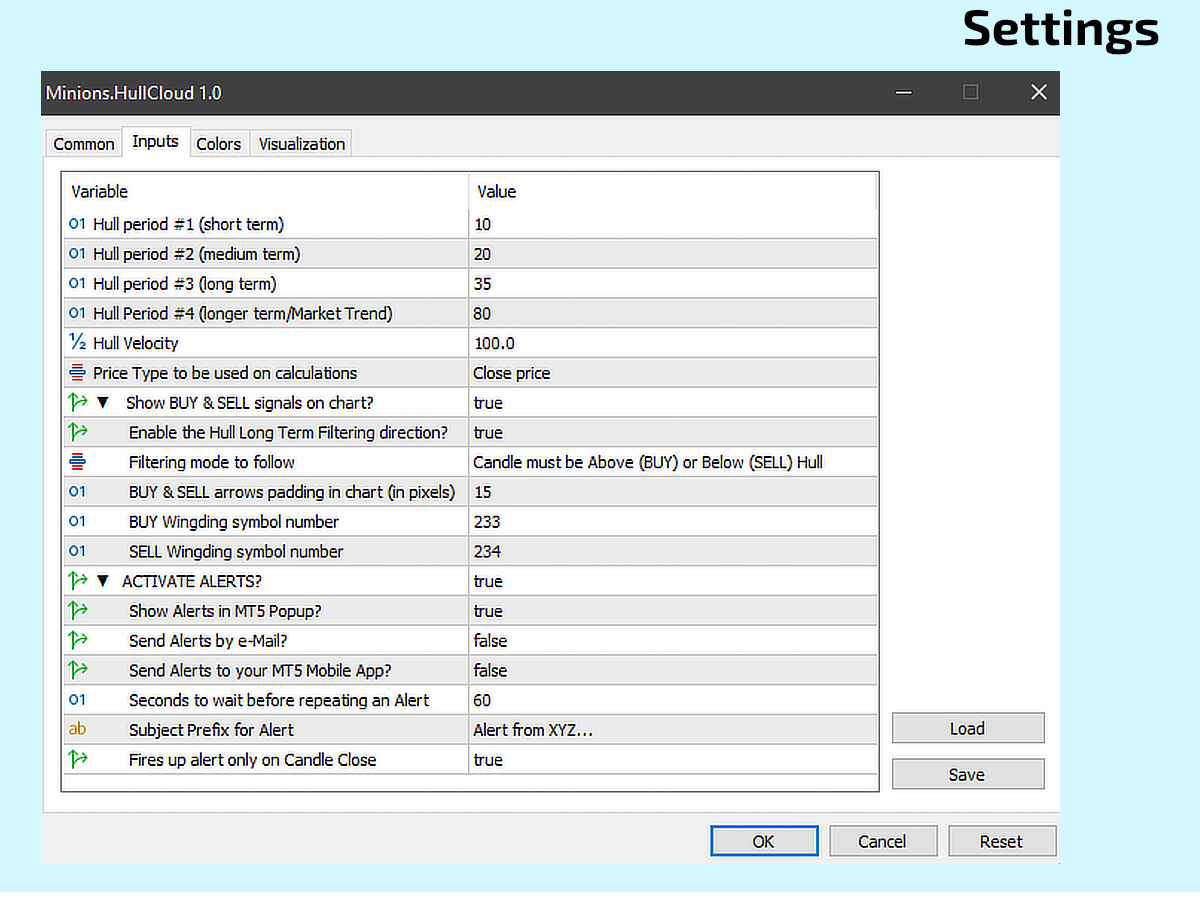
Ajustes
- Hull period #1 (corto plazo)
- Hull period #2 (medio plazo)
- Hull period #3 (largo plazo)
- Hull period #4 (largo plazo/Tendencia de mercado)
- Velocidad del casco
- Tipo de precio a utilizar en los cálculos
- ¿Mostrar señales de COMPRA y VENTA en el gráfico?
- ¿Habilitar la dirección de filtrado a largo plazo de Hull?
- Modo de filtrado a seguir
- Relleno de las flechas de COMPRA y VENTA en el gráfico (en píxeles)
- Número de símbolo Wingding de COMPRA
- VENDER número de símbolo Wingding
- ¿ACTIVAR ALERTAS?
- ¿Mostrar Alertas en Popup MT5?
- ¿Enviar Alertas por e-Mail?
- ¿Enviar Alertas a tu MT5 Mobile App?
- Segundos de espera antes de repetir una Alerta
- Prefijo del Asunto de la Alerta
- Alerta sólo al cierre de la vela
¿Quieres experimentar este indicador increíble GRATIS?
¡Explore nuestro poderoso indicador sin costo alguno! MetaTrader 5 ofrece dos maneras de probarlo: una demo limitada para backtesting o una prueba con todas las funciones a través de nuestro sitio web, lo que permite probar la cuenta real. ¡Echa un vistazo a esta entrada del blog para descubrir todas las opciones de prueba y empezar a operar de manera más inteligente hoy!
¿No ha encontrado la función que necesita?
Ningún producto es perfecto para todo el mundo. Si hay una función que necesita y no encuentra, póngase en contacto con nosotros. Valoramos sus comentarios.
Sobre Flavio Jarabeck
Flavio Jarabeck es el propietario de MinionsLabs.com, dedicada a mejorar las habilidades y conocimientos de los traders profesionales con avanzados robots de trading e indicadores, permitiéndoles explorar nuevas estrategias en diversos mercados y activos.