Hull Cloud
- Indikatoren
-
Flavio Javier Jarabeck
 We are a closed brotherhood of traders whose ultimate goal is to profit through well-studied, structured, and automated trades. As a result, we publish dozens of MT5 indicators (FREE and paid) to the global MQL5 community. 80% of our published products are high-quality free indicators so beginner
 - Version: 1.0
- Aktivierungen: 20
Der gleitende Hull-Durchschnitt ist bekannt für seine Fähigkeit, Verzögerungen zu reduzieren und eine klarere, genauere Darstellung von Markttrends zu liefern. Da er Preisdaten effektiver glättet als herkömmliche gleitende Durchschnitte, hilft er Händlern, Trendrichtungen und -umkehrungen mit größerer Präzision zu erkennen.
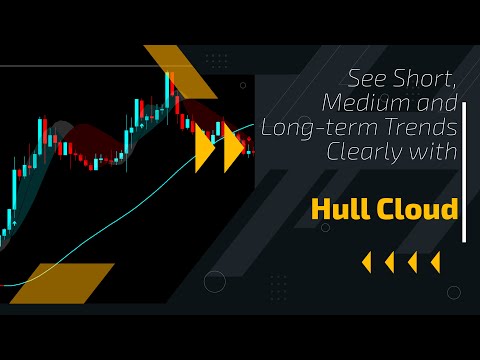
Der Hull-Cloud-Indikator steigert dies noch, indem er vier gleitende Hull-Durchschnitte verwendet, die wie ein Orchester zusammenarbeiten. Diese Kombination schafft ein dynamisches System, das kurz-, mittel- und langfristige Trends hervorhebt und Händlern einen umfassenden Überblick über Marktbewegungen und potenzielle Einstiegspunkte bietet.
Warum sollte ich mich für die Hull Cloud interessieren?
Die Hull Cloud ist ein sehr kreatives Instrument für Trendhändler. Ihre einzigartige Konfiguration aus mehreren gleitenden Hull-Durchschnitten erfasst Trendbewegungen gleich zu Beginn und verschafft so einen Vorteil in der schnelllebigen Handelsumgebung. Durch die frühzeitige Erkennung dieser Trends können sich Händler vorteilhaft positionieren und ihre Gewinne maximieren.
Mit seinen fortschrittlichen Funktionen und anpassbaren Einstellungen passt sich die Hull Cloud an Ihre Handelsstrategie an und bietet zeitnahe Warnungen und eine klare Visualisierung der Markttrends. Dieser Indikator ist unverzichtbar für Händler, die dem Markt einen Schritt voraus sein und fundierte Handelsentscheidungen auf der Grundlage einer zuverlässigen Trendanalyse treffen möchten.
Wie funktioniert die Hull Cloud?
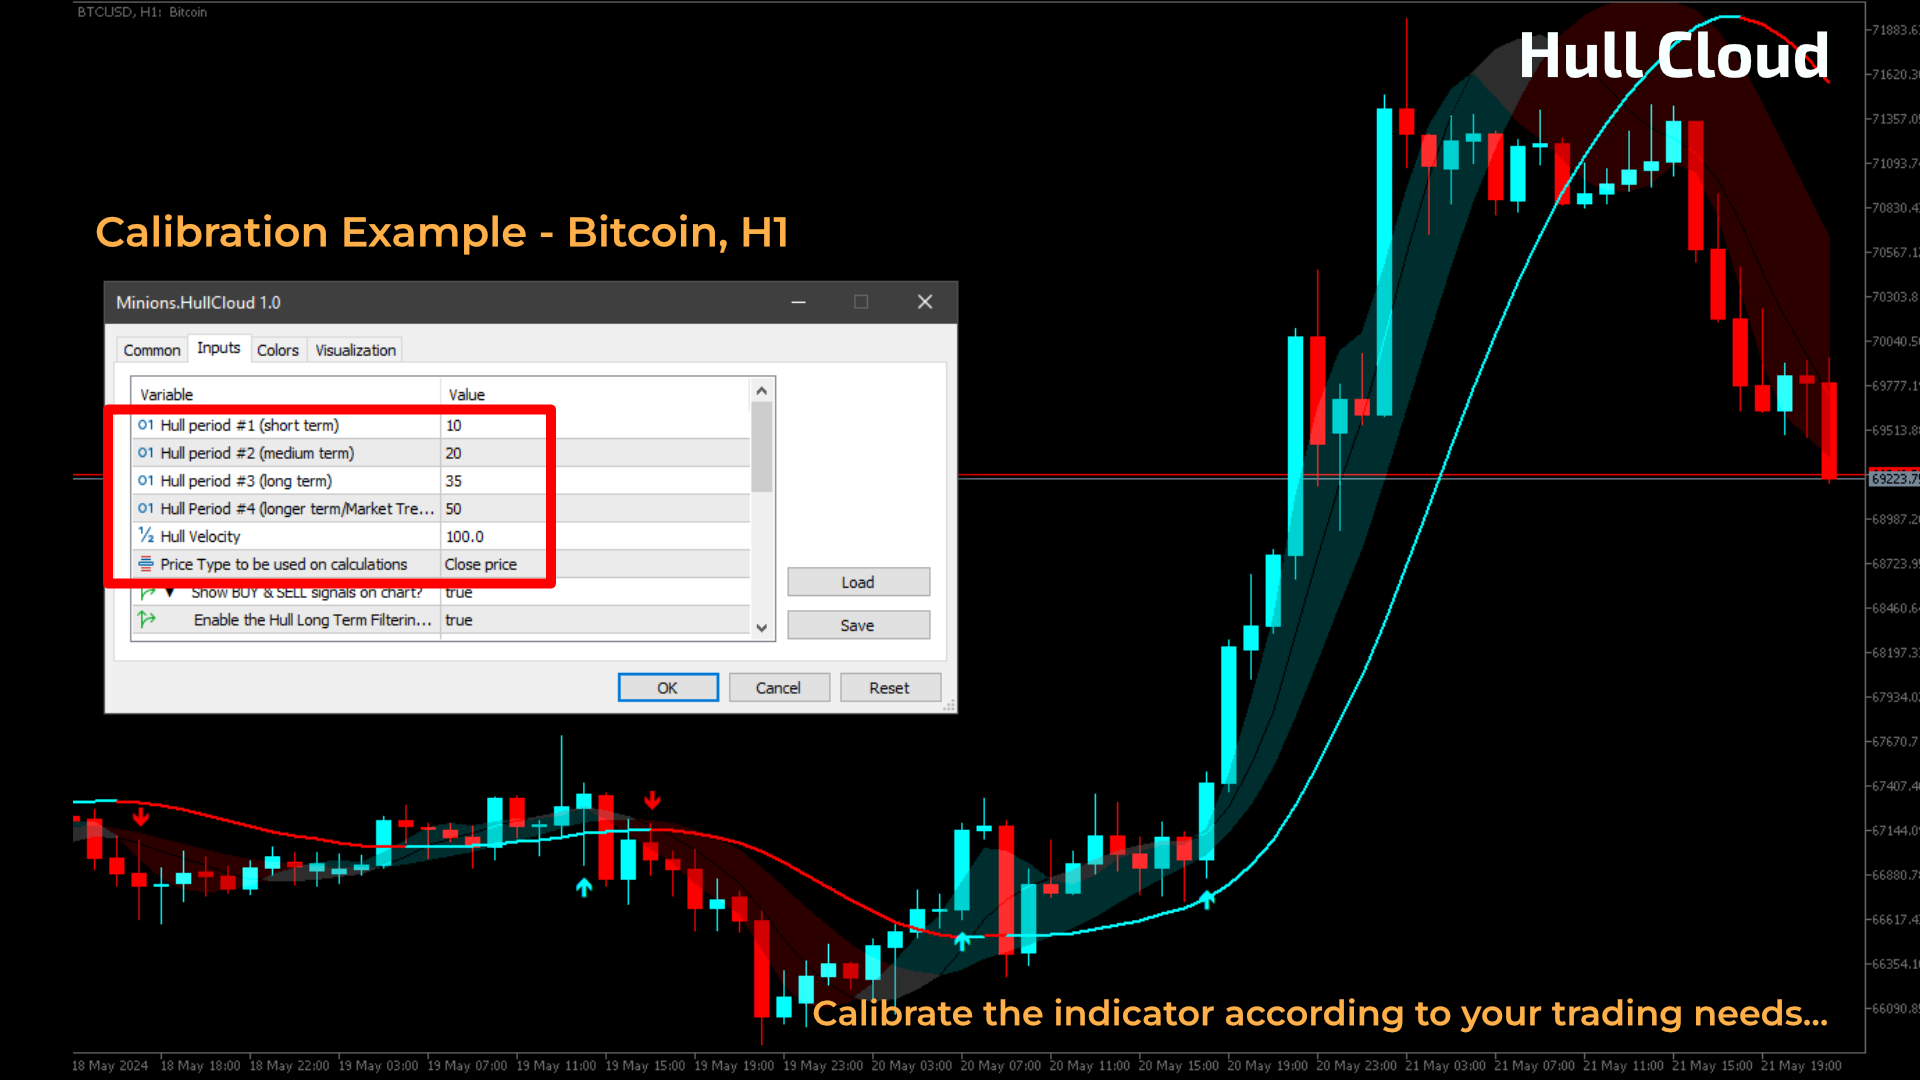
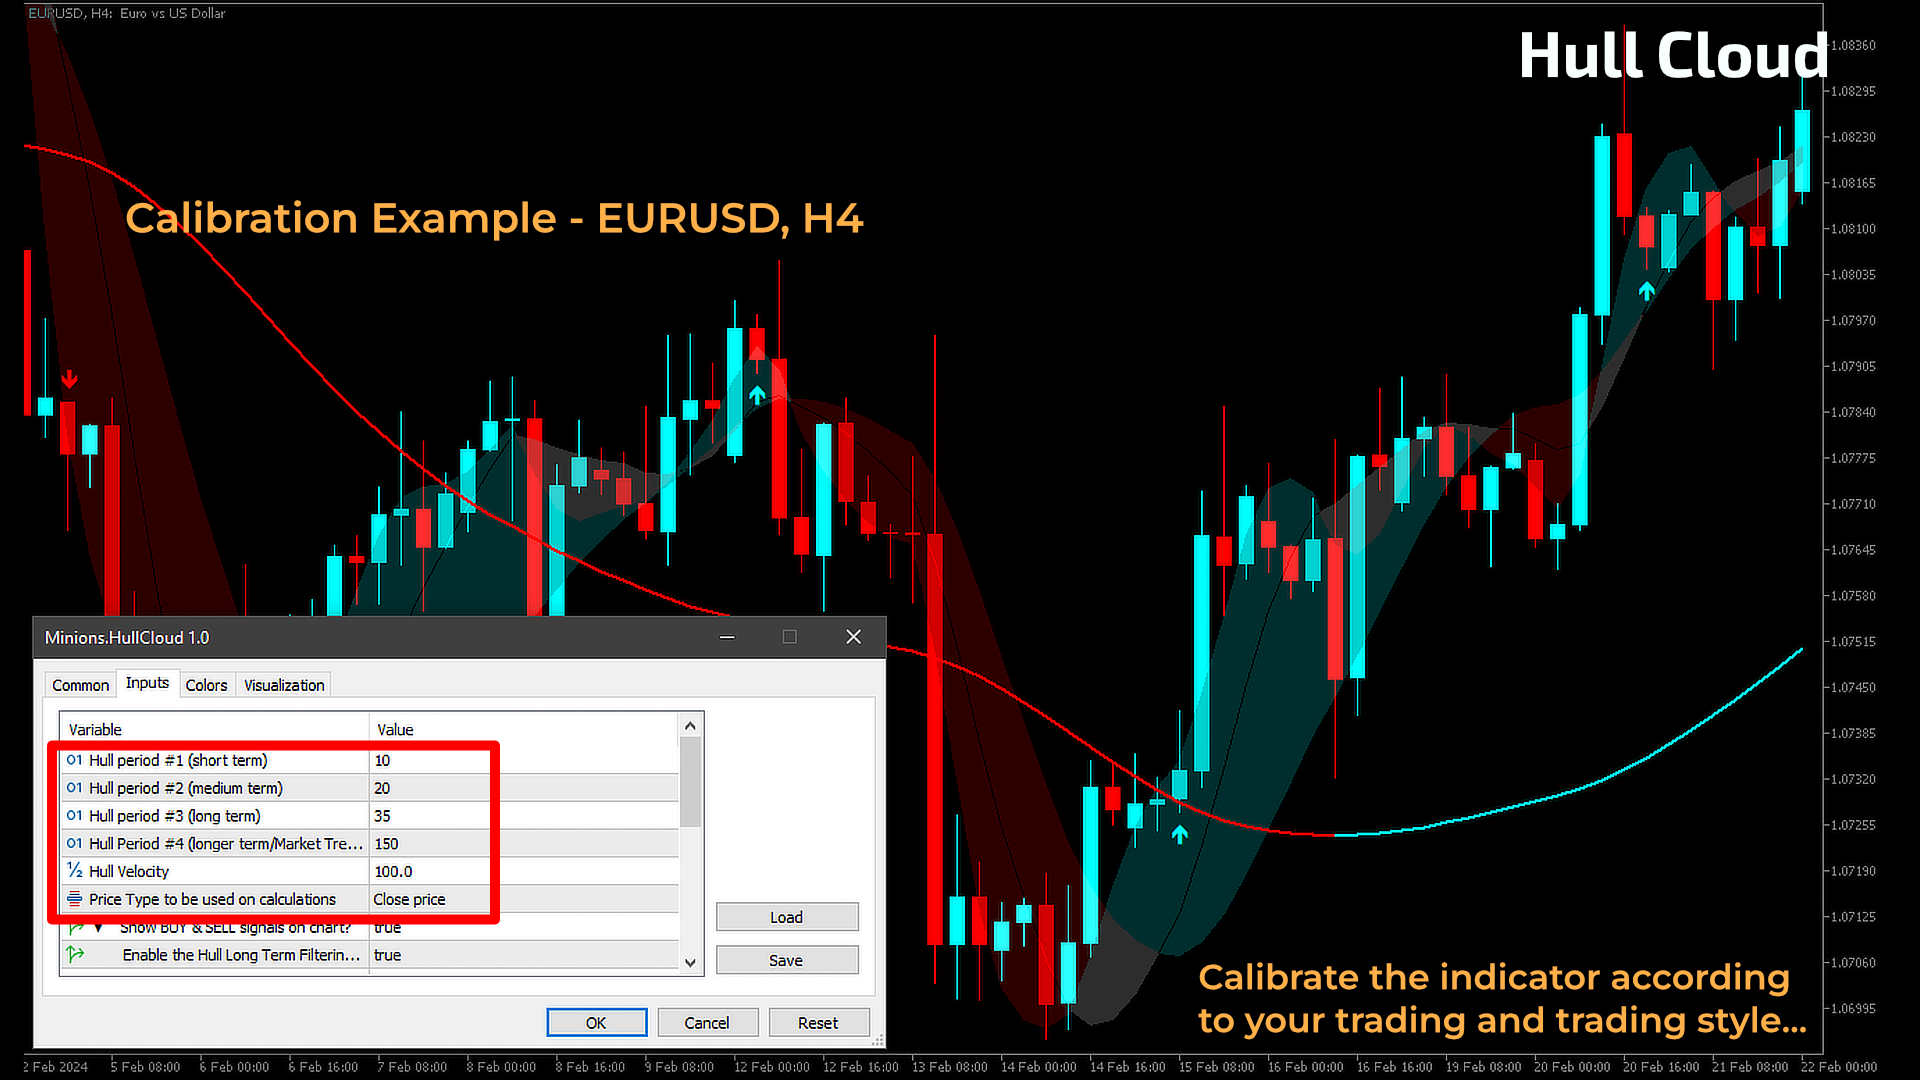
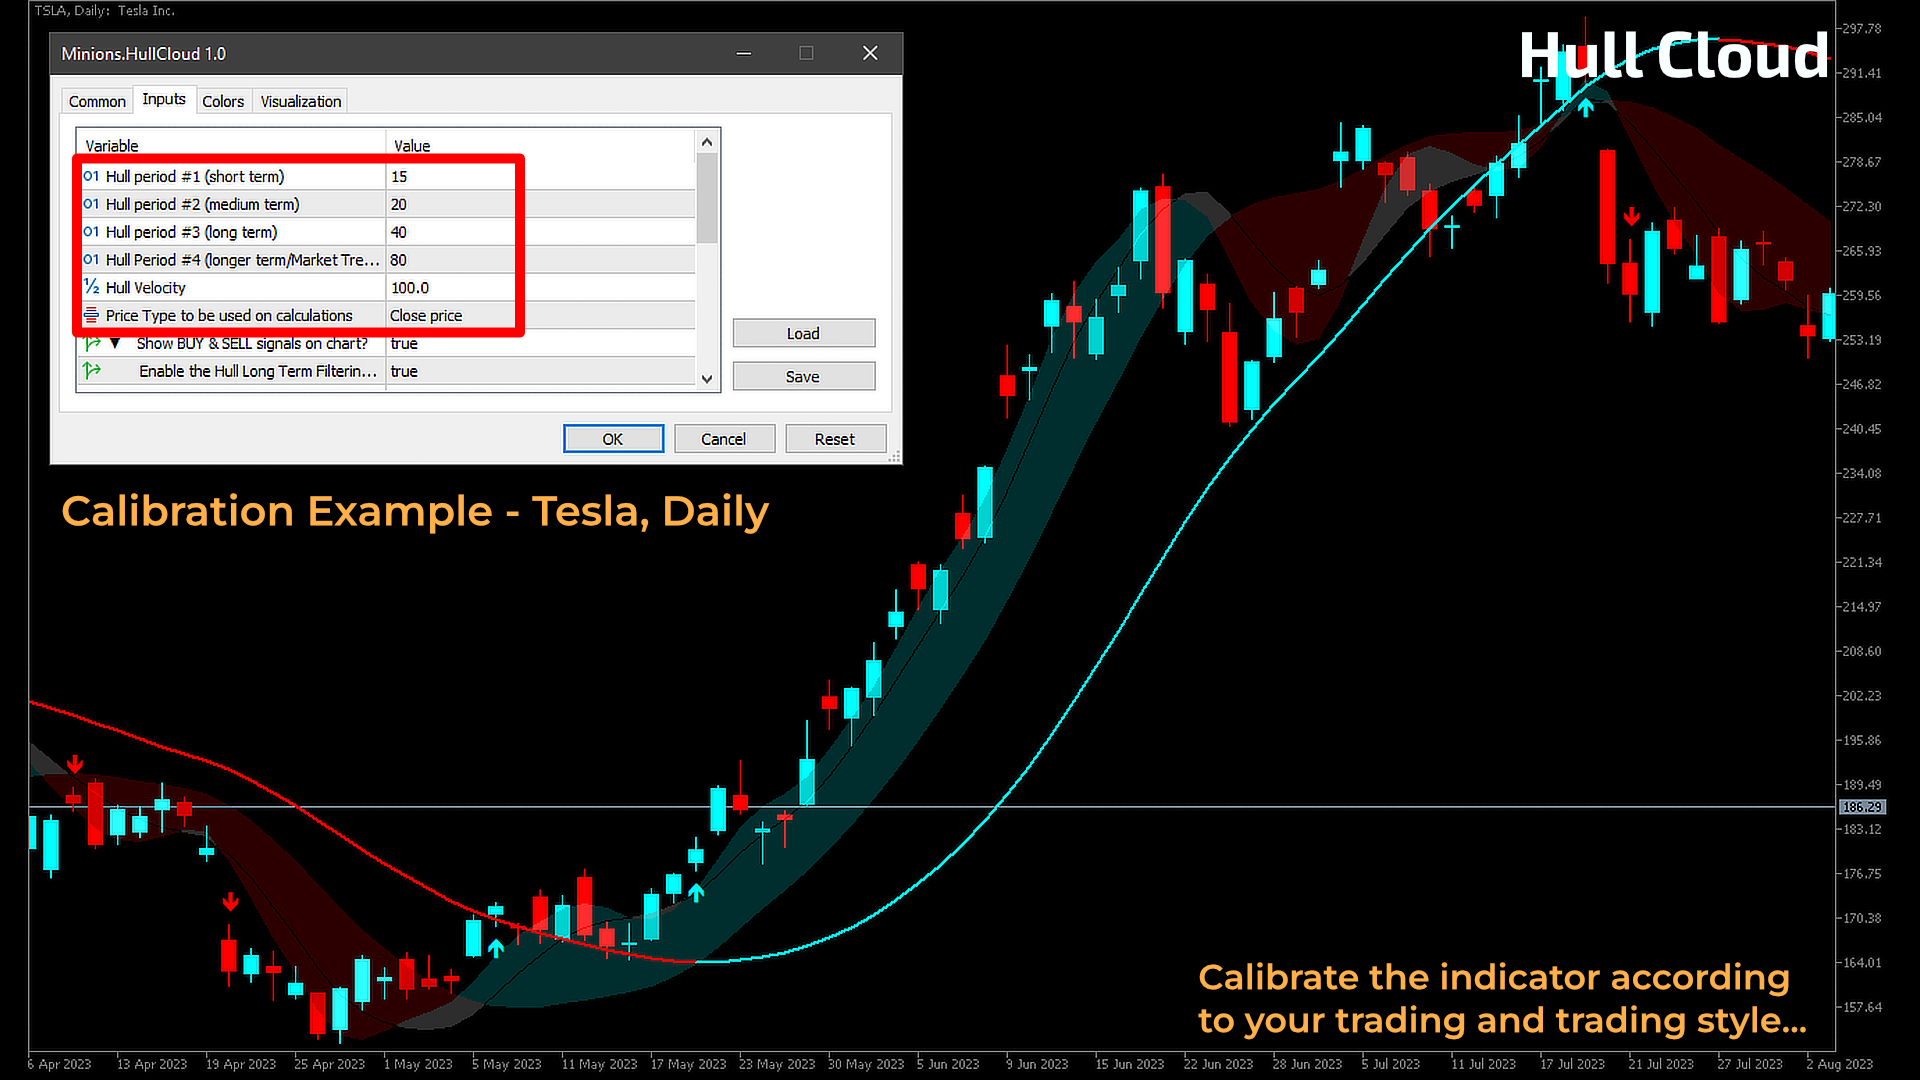
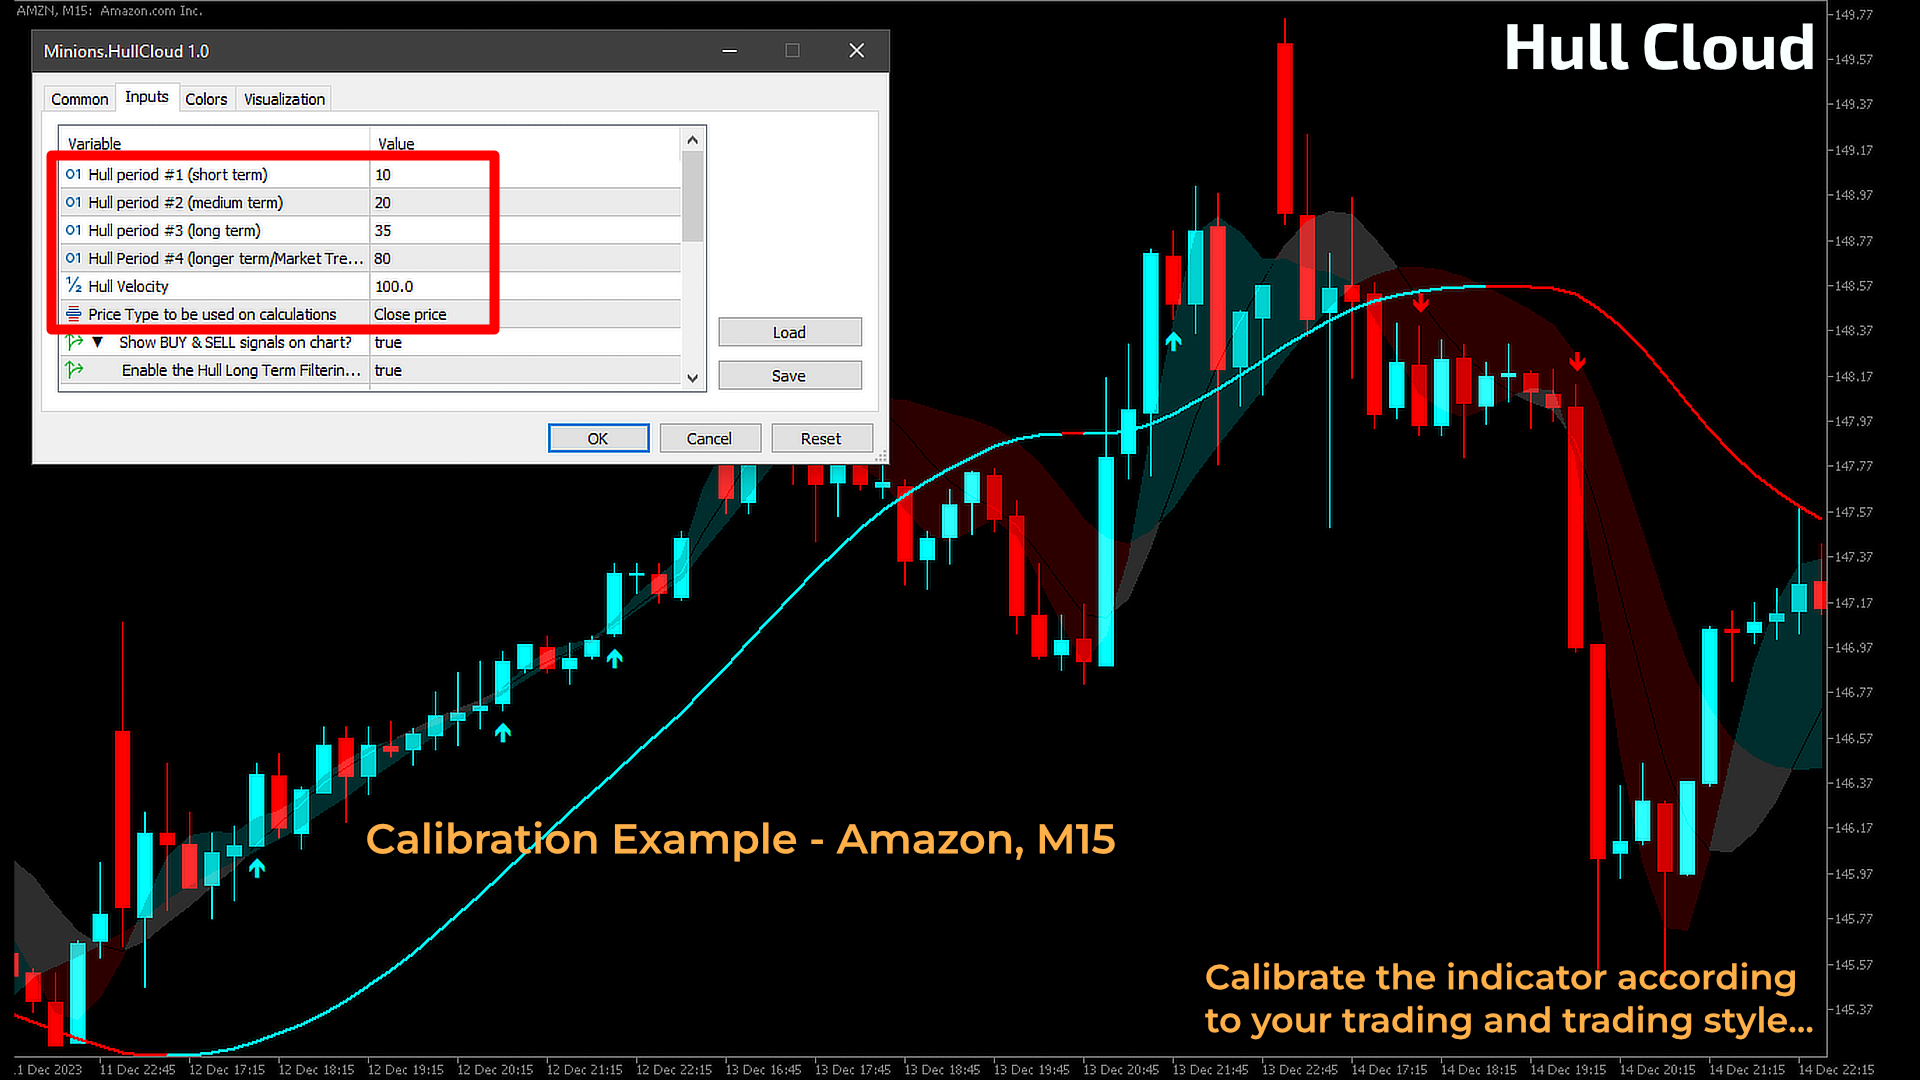
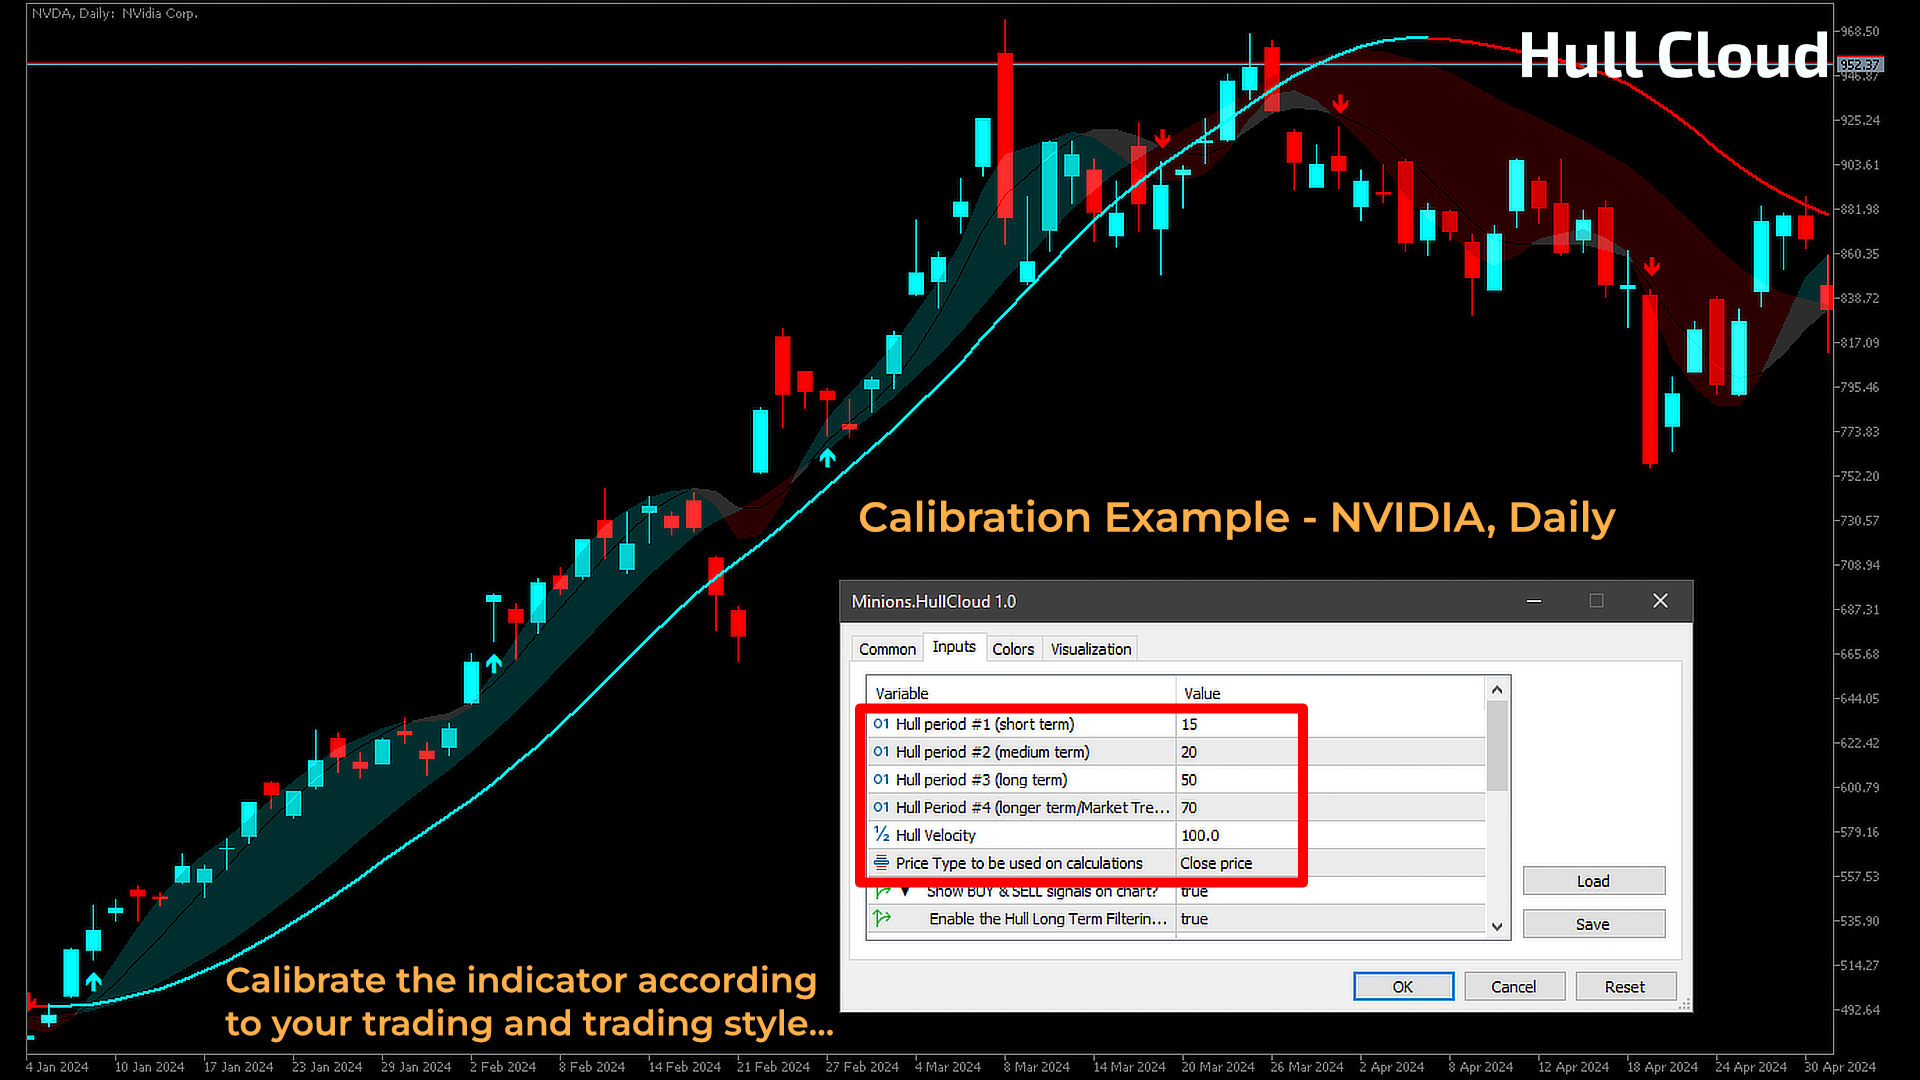
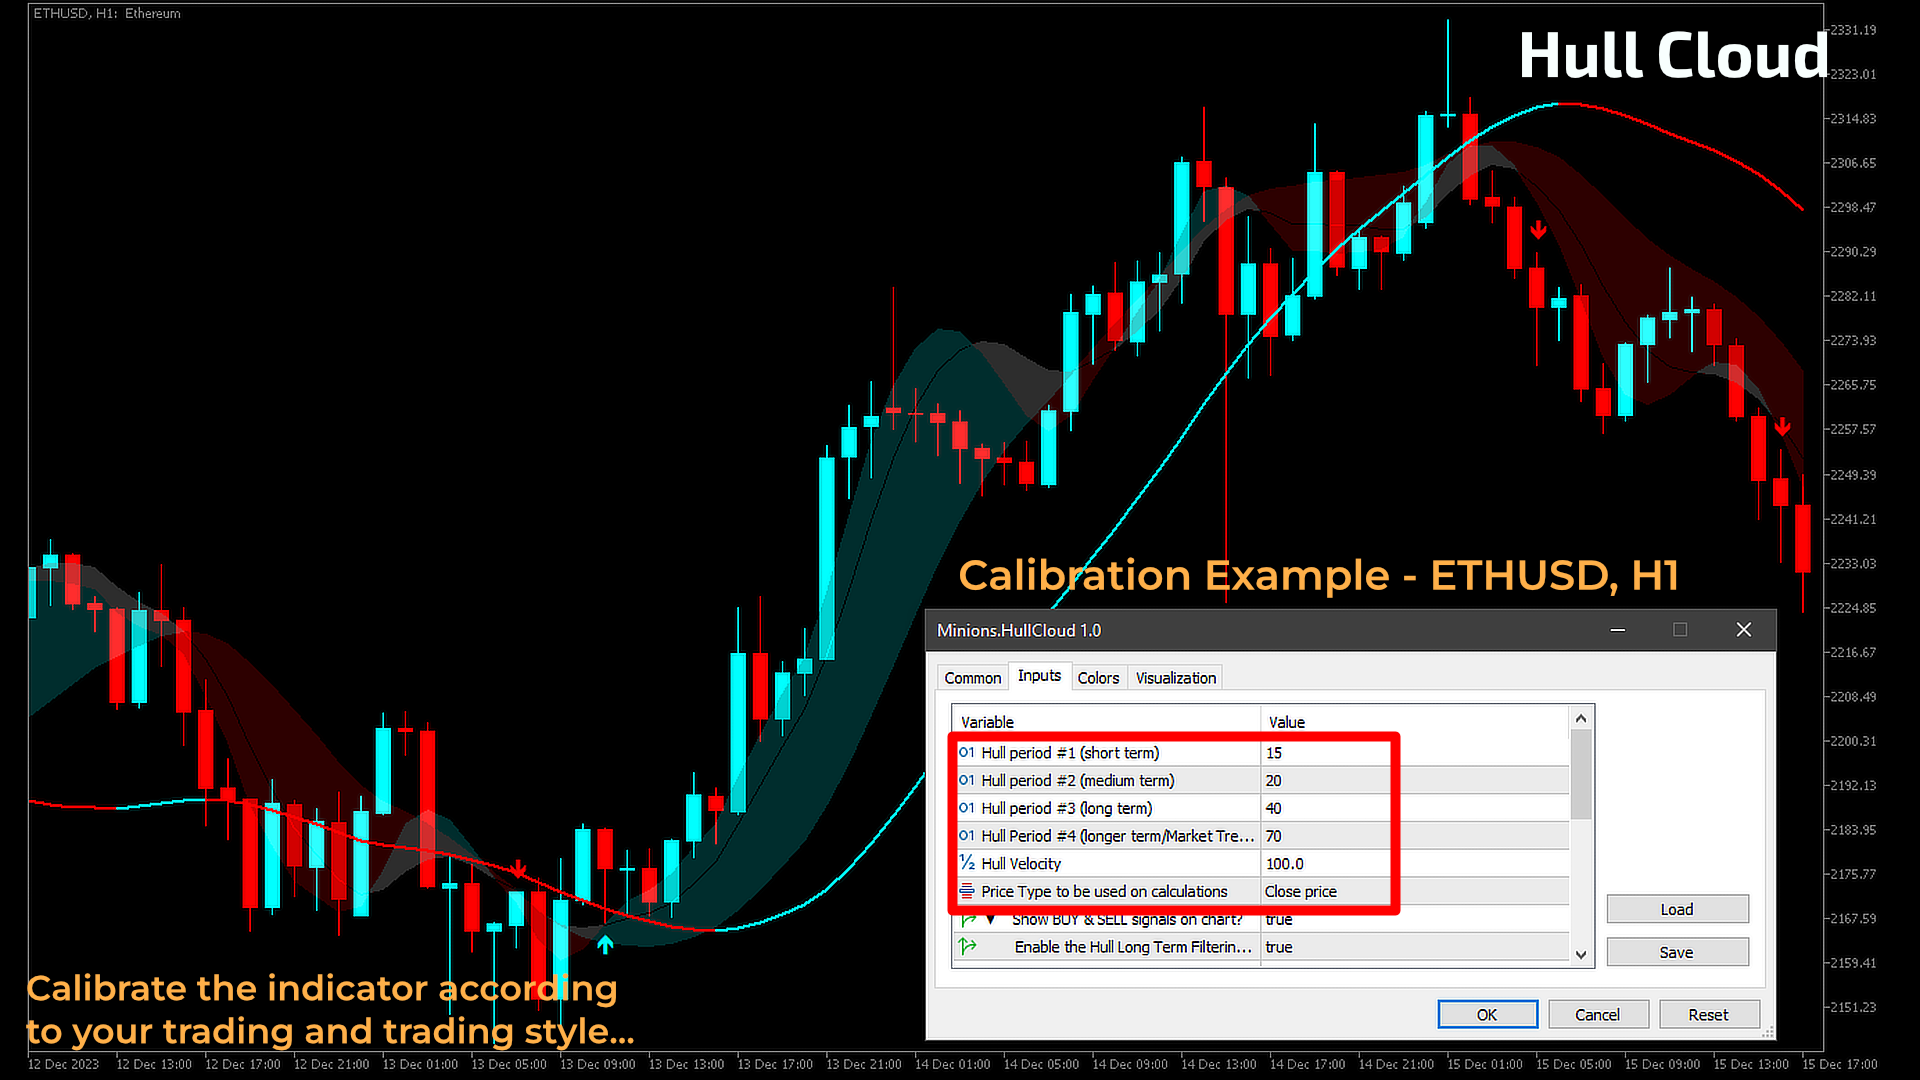
Wir haben zwei Hull Clouds auf dem Chart eingezeichnet, die dem Händler Einblicke in das Momentum geben. Der dritte Hull-Durchschnitt zeigt die globale Trendrichtung an, ein hochperiodischer Hull-Durchschnitt, der das Marktmomentum anzeigt. Bei richtiger Kalibrierung bietet die Hull Cloud großzügige Einblicke in kurz-, mittel- und langfristige Trends und gibt Hinweise auf den richtigen Zeitpunkt, um auf den Trend aufzuspringen. Zwar ist kein Indikator der Heilige Gral, aber das Wissen um wichtige Unterstützungs- und Widerstandspunkte und den allgemeinen Trend wird Ihre Handelsentscheidungen verbessern.
Wie kann man den Hull-Cloud-Indikator "lesen"?
- Ausrichtung der drei Hull-Durchschnittswerte, die die beiden farbigen Hull-Wolken auf dem Chart bilden.
- Aktivieren Sie die KAUF- und VERKAUFSSIGNALE, um sie deutlich auf Ihrem Chart zu sehen.
- Aktivieren Sie außerdem das Alarmsystem, um Benachrichtigungen über Popups, E-Mail oder die MT5-App bei einem KAUF- und VERKAUFssignal zu erhalten.
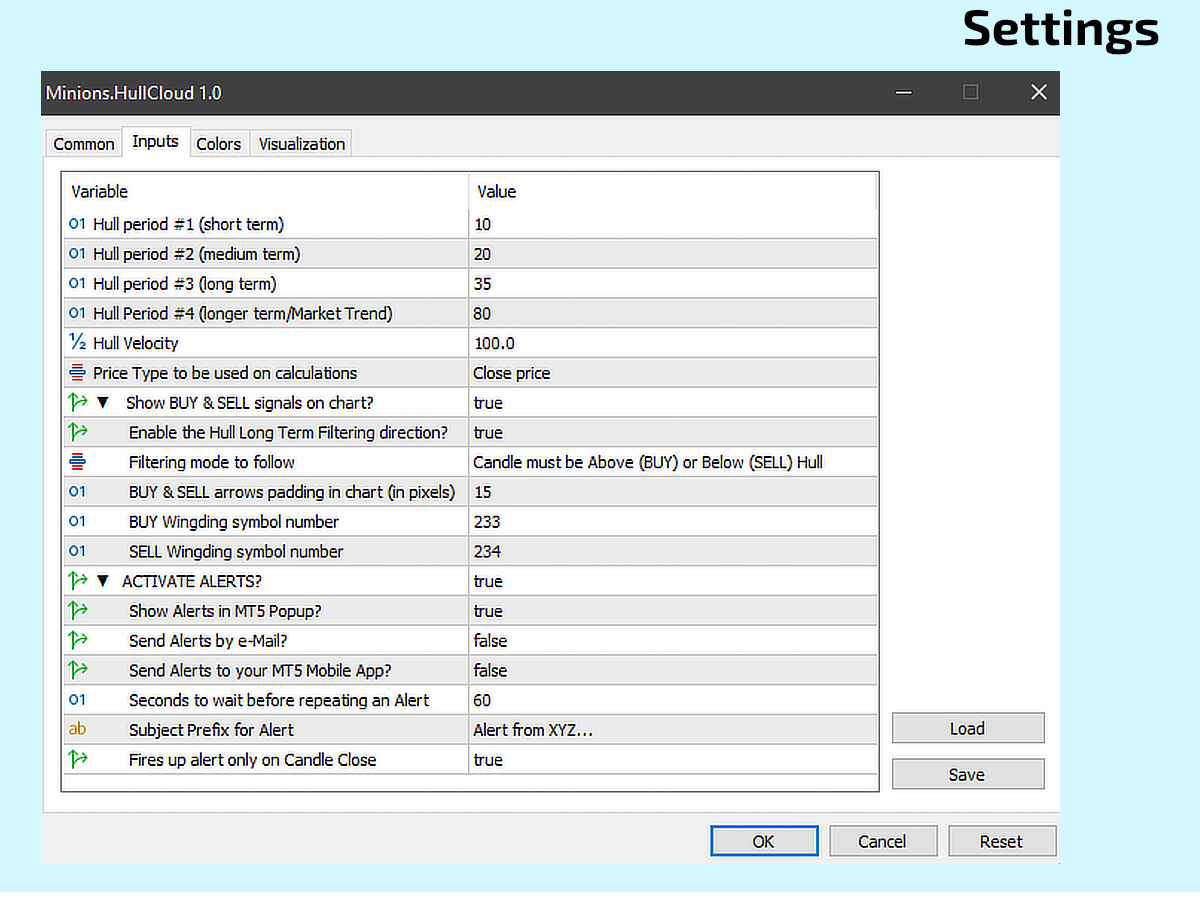
Einstellungen
- Hüllperiode #1 (kurzfristig)
- Rumpfperiode #2 (mittelfristig)
- Rumpfperiode #3 (langfristig)
- Hüllperiode #4 (längerfristig/Markttrend)
- Hull-Geschwindigkeit
- Preistyp, der für die Berechnungen verwendet wird
- BUY & SELL Signale auf dem Chart anzeigen?
- Aktivieren Sie die Hull Long Term Filtering Richtung?
- Zu befolgender Filterungsmodus
- BUY & SELL Pfeile im Chart (in Pixel)
- BUY Wingding Symbol Nummer
- SELL Wingding-Symbolnummer
- ALARME AKTIVIEREN?
- Alarme im MT5 Popup anzeigen?
- Alarme per E-Mail senden?
- Alarme an Ihre MT5 Mobile App senden?
- Wartende Sekunden vor der Wiederholung eines Alerts
- Betreff-Präfix für Alert
- Löst nur bei Kerzenschluss einen Alarm aus
Möchten Sie diesen erstaunlichen Indikator KOSTENLOS erleben?
Erforschen Sie unseren leistungsstarken Indikator ohne jegliche Kosten! MetaTrader 5 bietet zwei Möglichkeiten, ihn zu testen: eine begrenzte Demo für Backtests oder eine voll funktionsfähige Testversion über unsere Website, die das Testen auf einem Live-Konto ermöglicht. In diesem Blog-Beitrag erfahren Sie alles über die Testmöglichkeiten und können noch heute intelligenter handeln!
Sie haben eine Funktion nicht gefunden, die Sie benötigen?
Kein Produkt ist perfekt für jeden. Wenn Sie eine Funktion benötigen, die Sie nicht finden können, wenden Sie sich bitte an uns. Wir schätzen Ihr Feedback!
Über uns
Flavio Jarabeck ist der Eigentümer von MinionsLabs.com, das sich zum Ziel gesetzt hat, die Fähigkeiten und das Wissen professioneller Händler mit fortschrittlichen Handelsrobotern und Indikatoren zu verbessern, um ihnen die Möglichkeit zu geben, neue Strategien für verschiedene Märkte und Vermögenswerte zu erforschen.