Smart Heikin Ashi CompactView MTF
- Indicadores
-
Flavio Javier Jarabeck
 We are a closed brotherhood of traders whose ultimate goal is to profit through well-studied, structured, and automated trades. As a result, we publish dozens of MT5 indicators (FREE and paid) to the global MQL5 community. 80% of our published products are high-quality free indicators so beginner
 - Versión: 1.0
- Activaciones: 20
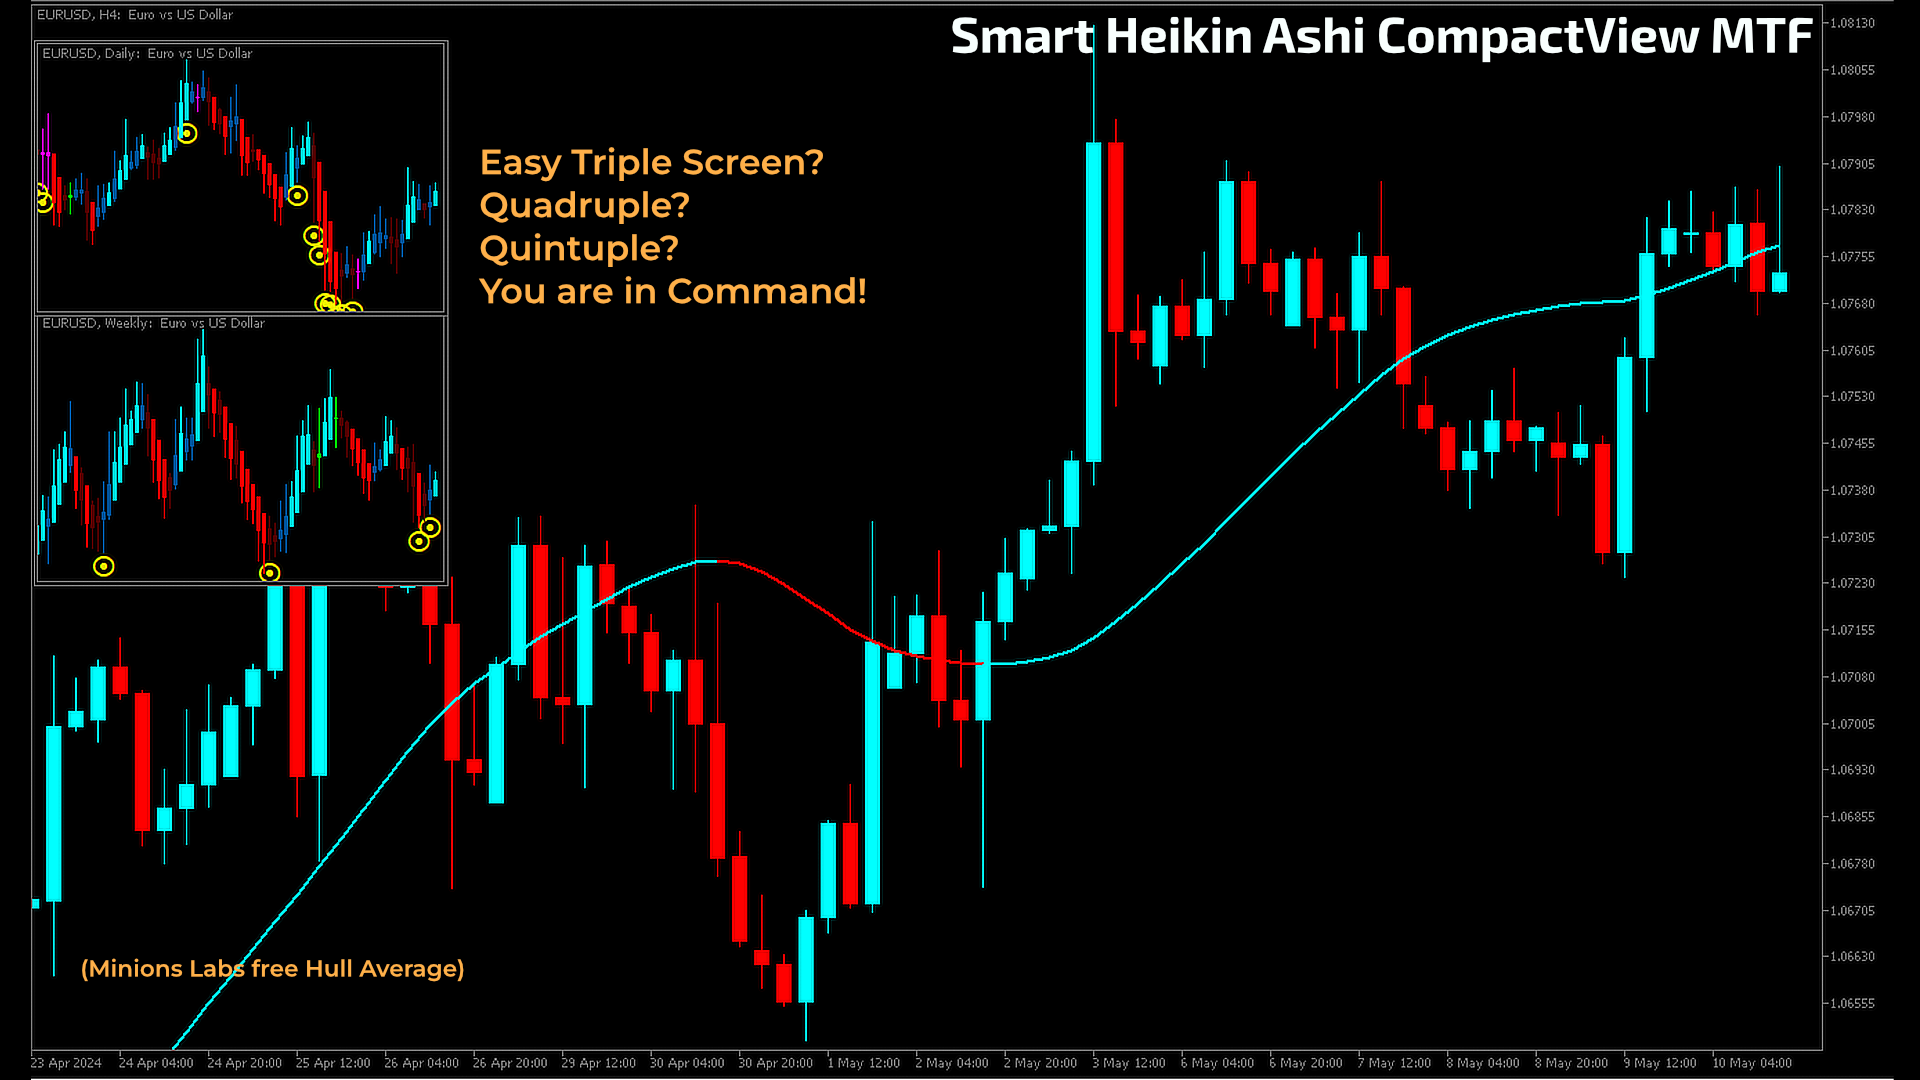
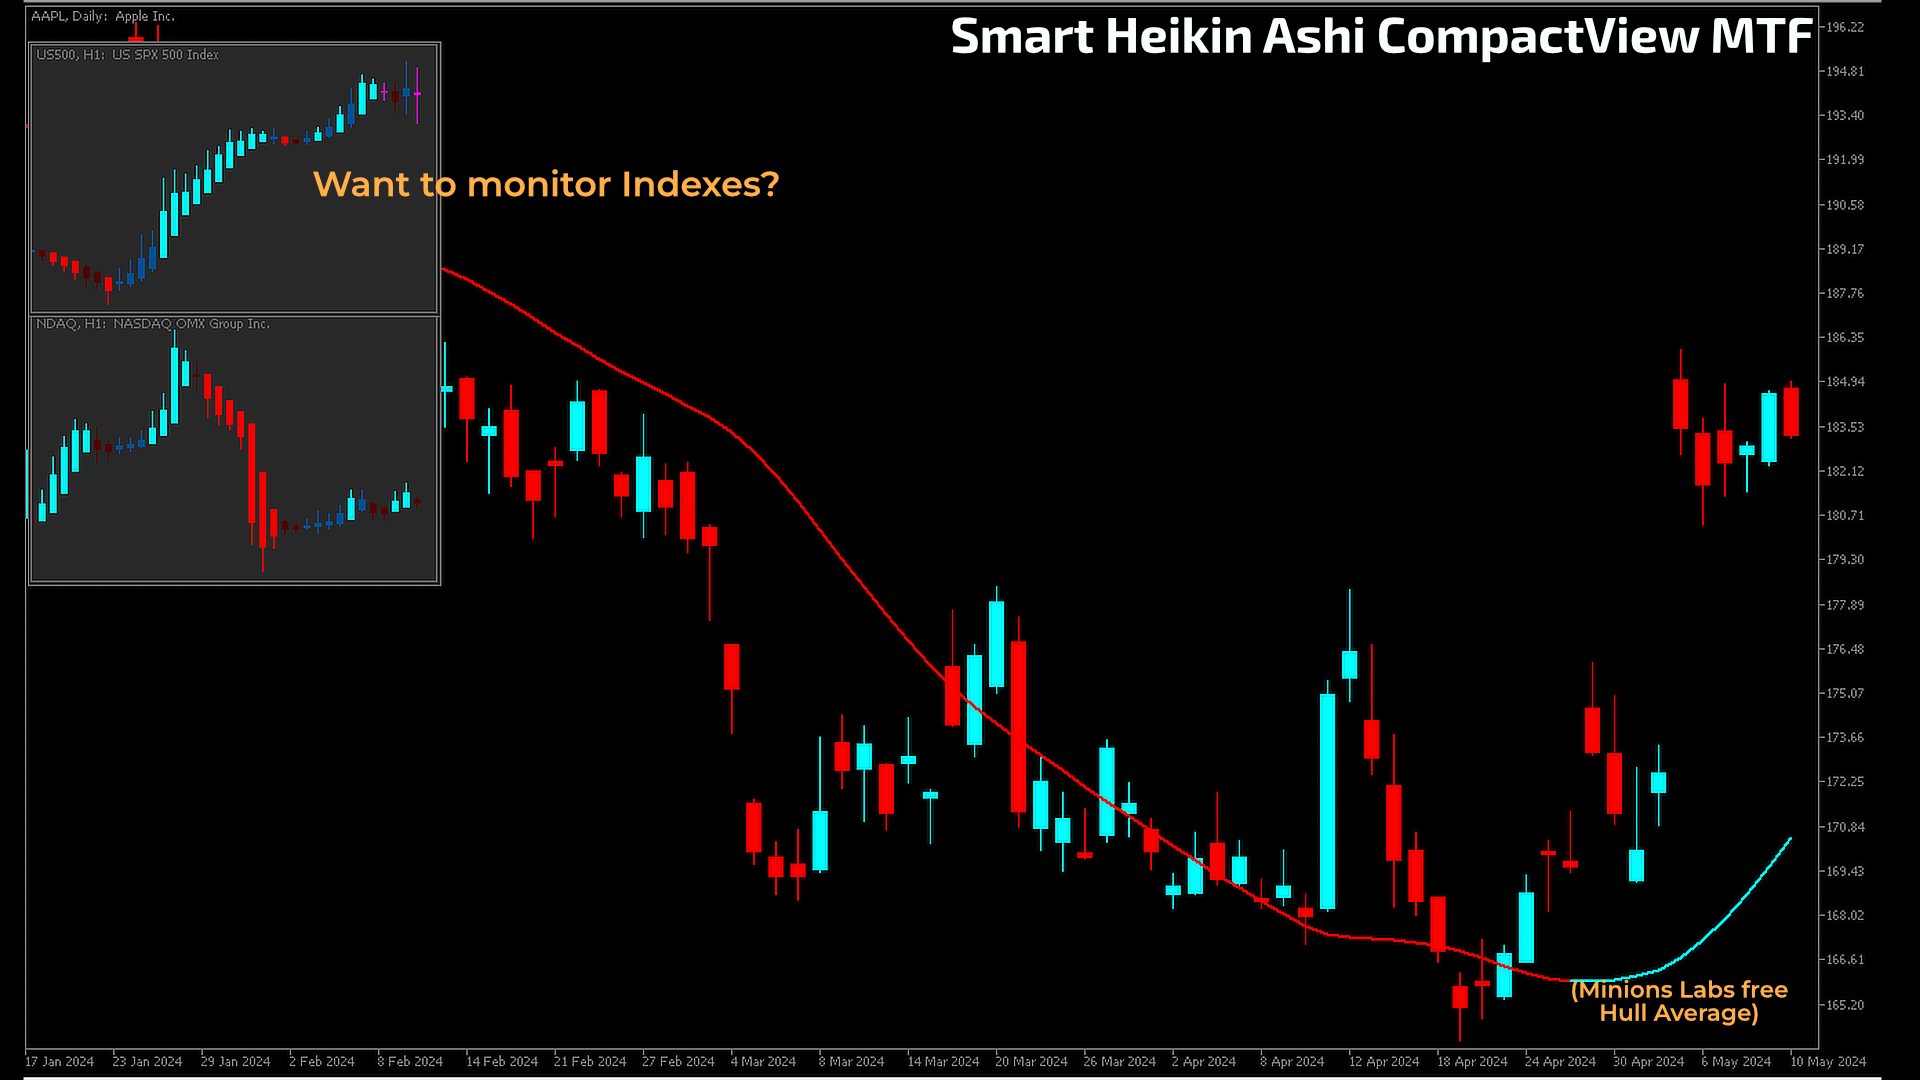
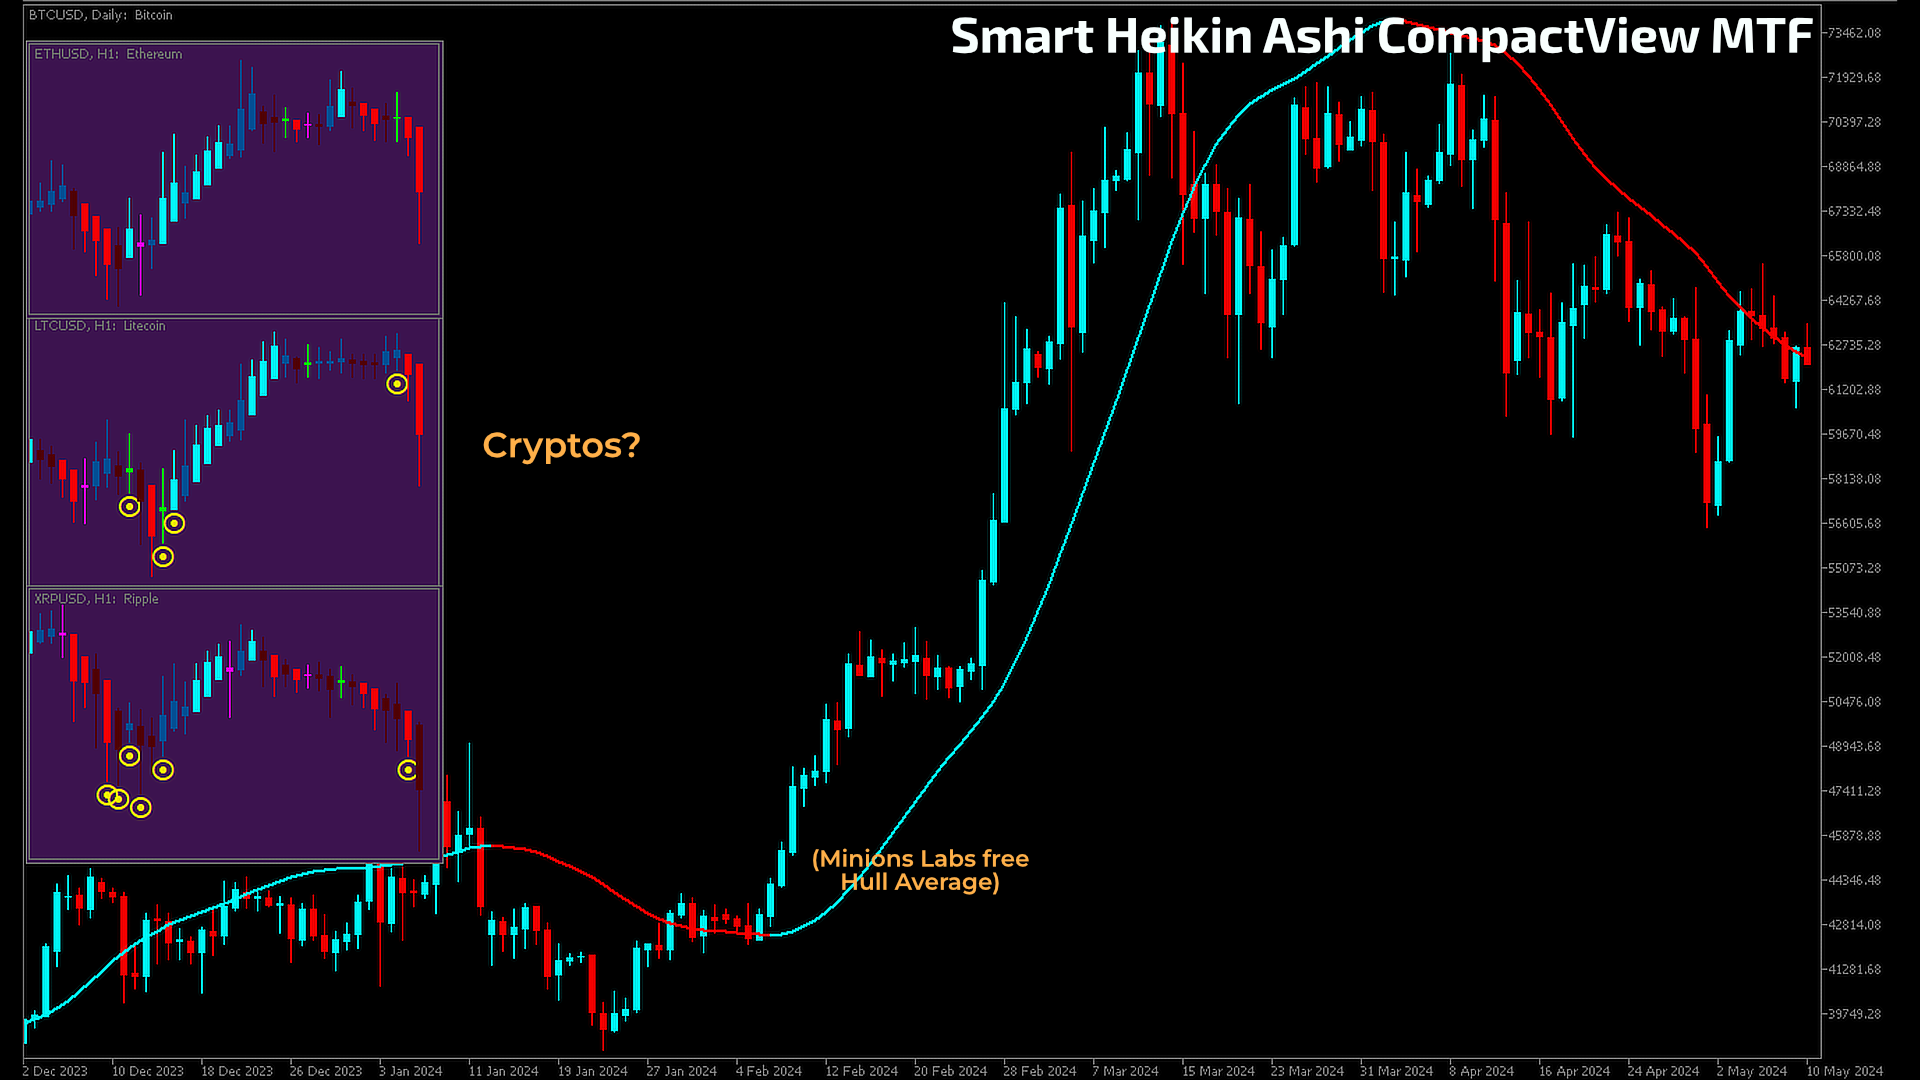
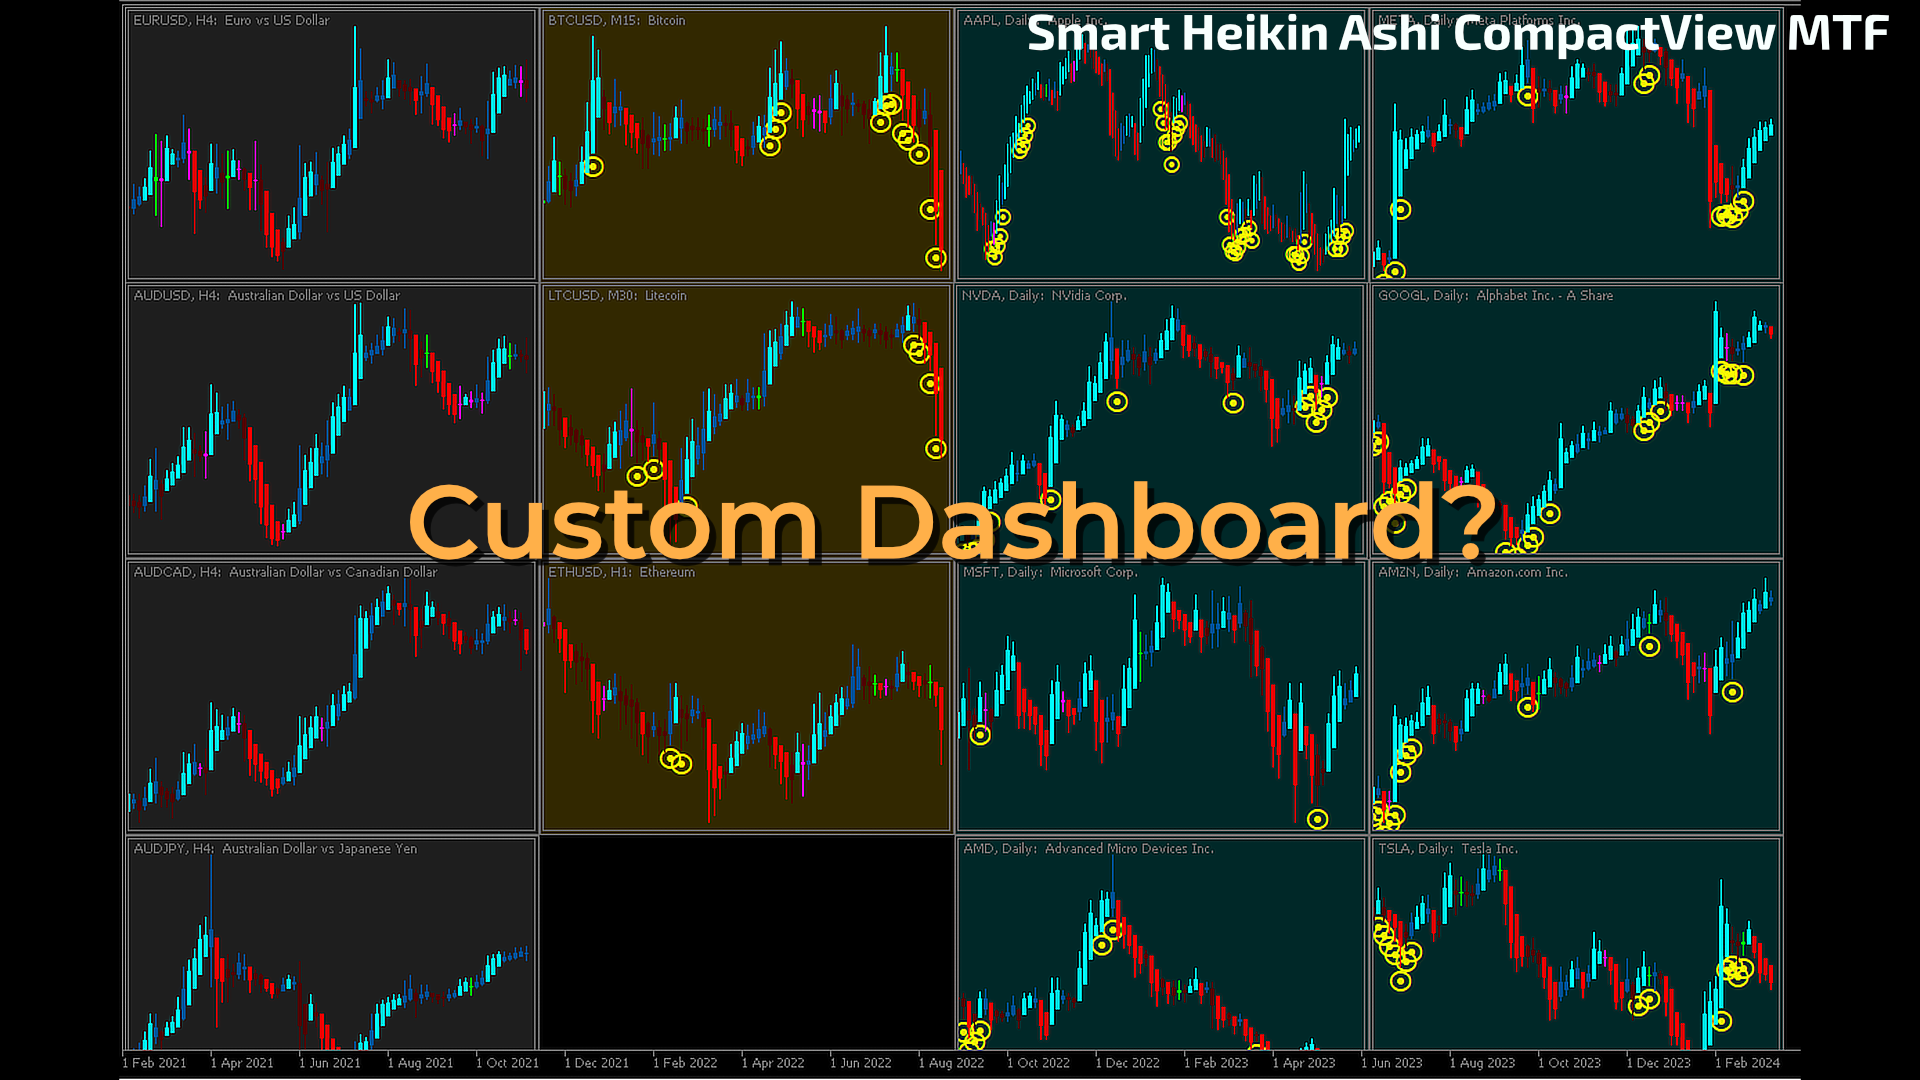
¿Ya es un fan de la herramienta de análisis gráficoMinions Labs Smart Heikin Ashi ? ¿O quizás está buscando un gráfico Heikin Ashi versátil capaz de operar en múltiples marcos temporales? ¿Quiere ver el panorama general antes de sumergirse en los detalles, para tomar decisiones de ENTRADA más inteligentes? ¿Quiere construir su propio Tablero de Símbolos en un solo gráfico, sin tener que lidiar con el desordenado MT5 multi-ventana?
¡Bienvenido al indicador Smart Heikin Ashi CompactView MTFde Minions Labs ! Por favor, vea el poder de este indicador en las capturas de pantalla a continuación... Te sorprenderá!
¿POR QUÉ DEBERÍA IMPORTARME el indicador Smart Heikin Ashi CompactView MTF?
El Smart Heikin Ashi es una herramienta innovadora que mejora su capacidad para detectar movimientos significativos, dojis, y áreas de alto volumen en el gráfico Heikin Ashi. Pero, adoptar un enfoque multi-marco de tiempo puede ser complejo, y mostrarlo en una sub-ventana no siempre es práctico, mientras que integrarlo directamente en el gráfico principal puede resultar desordenado. Aquí entra la solución CompactView deMinions Labs .
¿CÓMO FUNCIONA EL MTF Smart Heikin Ashi CompactView?
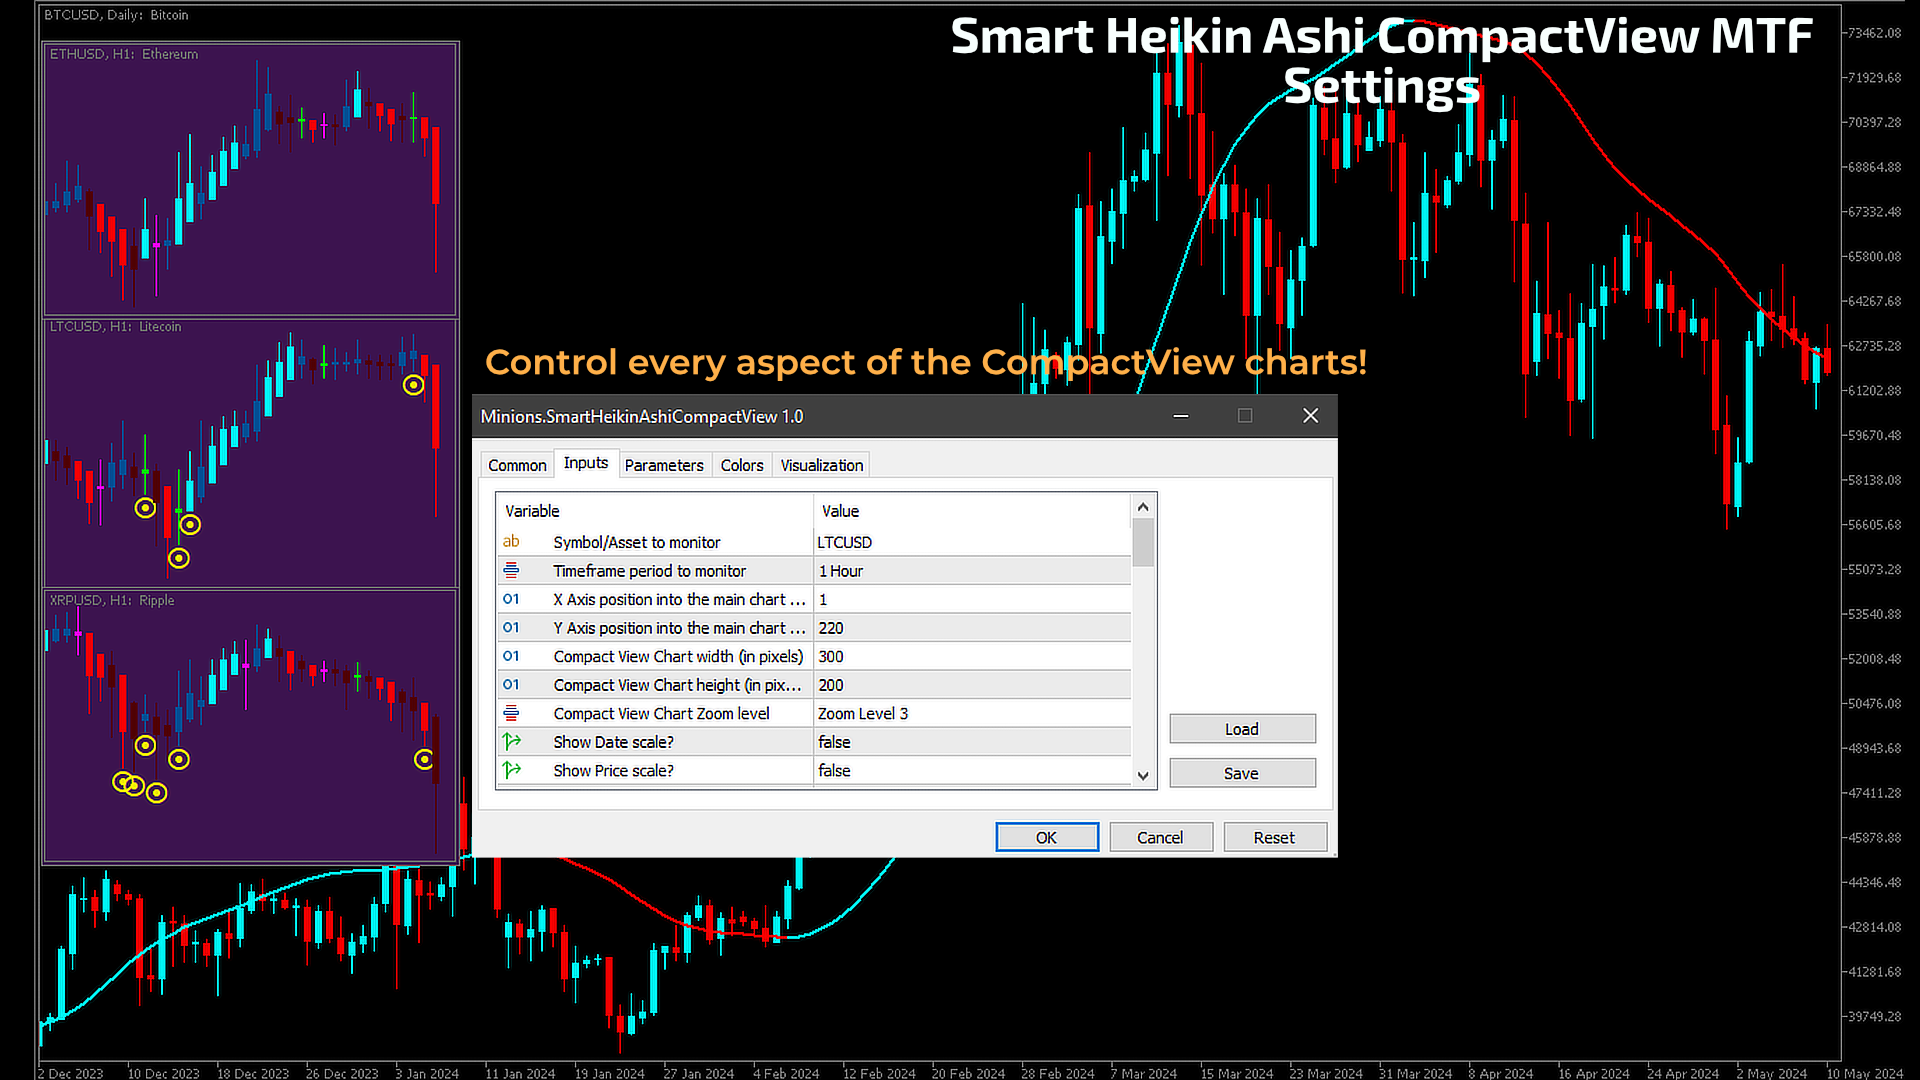
El propio gráfico Smart Heikin Ashi mejora sus herramientas gráficas destacando los movimientos fuertes y los posibles puntos de reversión a través de sus indicadores doji. Incorpora una alerta de alto volumen en el gráfico para resaltar los volúmenes de negociación significativos y ofrece parámetros personalizables para definir lo que constituye un Doji. La función CompactView le permite establecer su PROPIO marco temporal en el activo en una ventana flotante colocada donde desee. Personalice el tamaño y la combinación de colores para adaptarlos a su estilo de negociación.
¡Cada aspecto de este indicador es totalmente personalizable! Genial, ¿verdad?
¡No MT5 Hacks! Sólo puro y altamente creativo y optimizado código MQL5 para entregar lo que usted necesita. Y punto.
En Minions Labs llevamos MT5 hasta sus límites, ya lo sabes por nuestros otros productos. Y, si aún no nos conoces, no dudes en visitar nuestras docenas de productos, gratuitos y de pago... https://www.mql5.com/en/users/fjarabeck/seller
AJUSTES
Configuración general de gráficos:
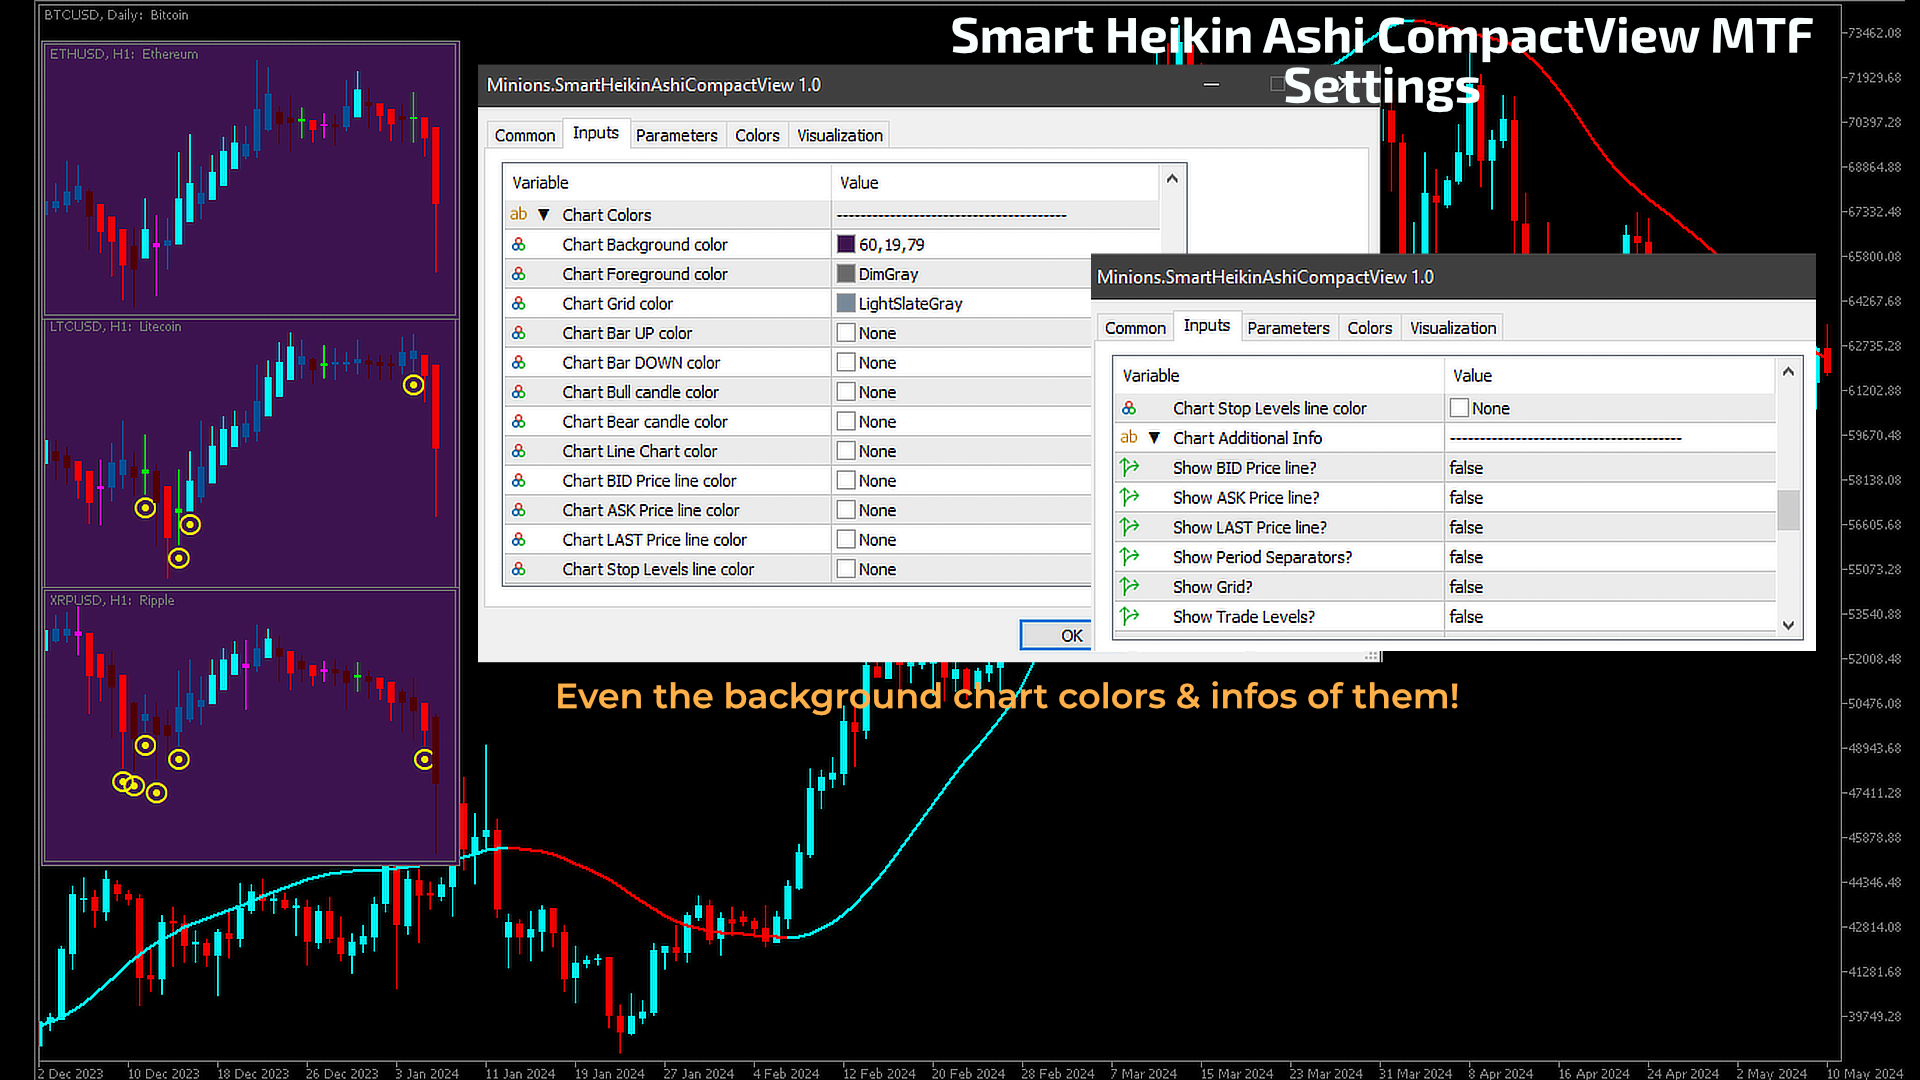
- Colores del gráfico: Ajuste los colores de fondo, primer plano, rejilla, barra ARRIBA/ABAJO, vela alcista/bajista, gráfico de líneas, línea de precio OFERTA/PEDIDO/ÚLTIMO y línea de niveles de stop.
Opciones de visualización:
- Gráfico Información adicional: Elija mostrar líneas de precio BID, ASK, LAST, separadores de periodo, rejilla y niveles de operación.
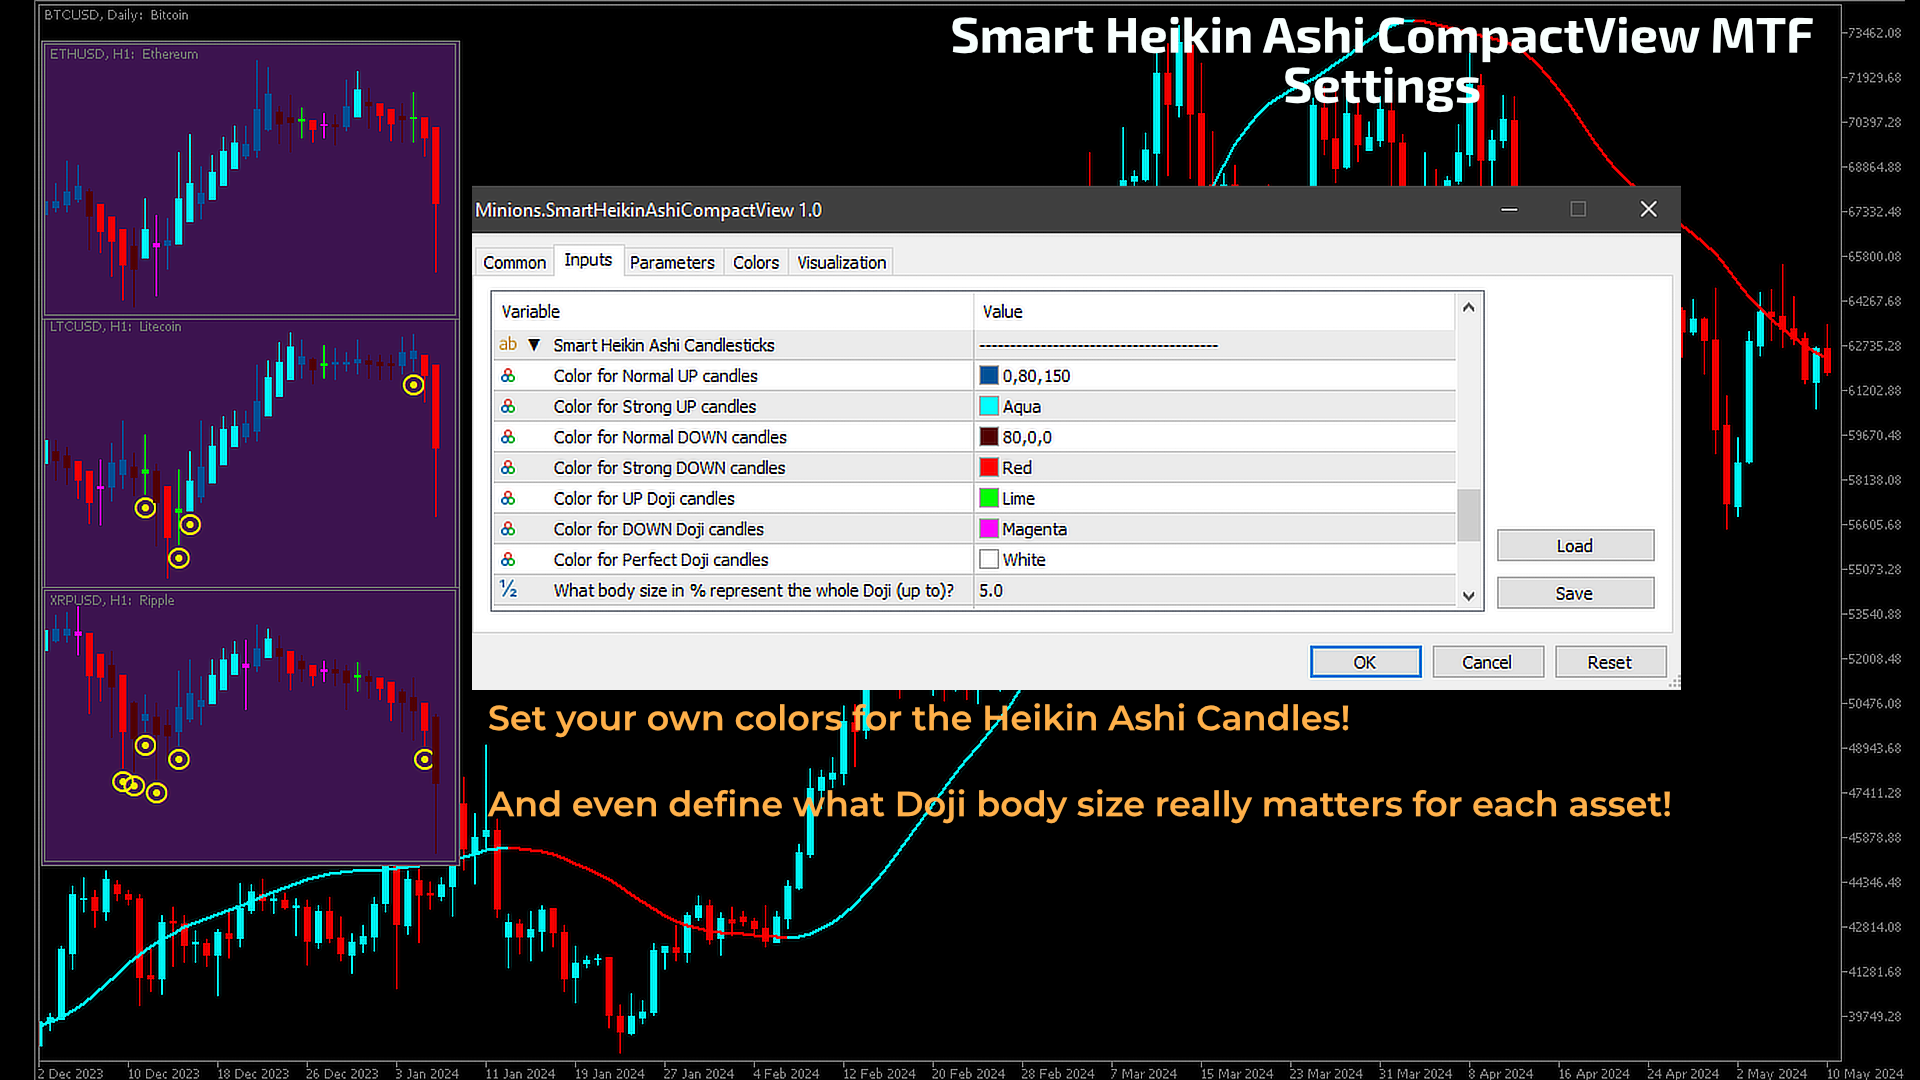
Configuración de Velas Smart Heikin Ashi:
- Colores de Velas: Configure los colores para las velas Normal ARRIBA, Fuerte ARRIBA, Normal ABAJO, Fuerte ABAJO, Doji ARRIBA, Doji ABAJO y Doji Perfecto.
- Configuración del Tamaño Doji: Defina qué porcentaje del tamaño del cuerpo representa una vela Doji.
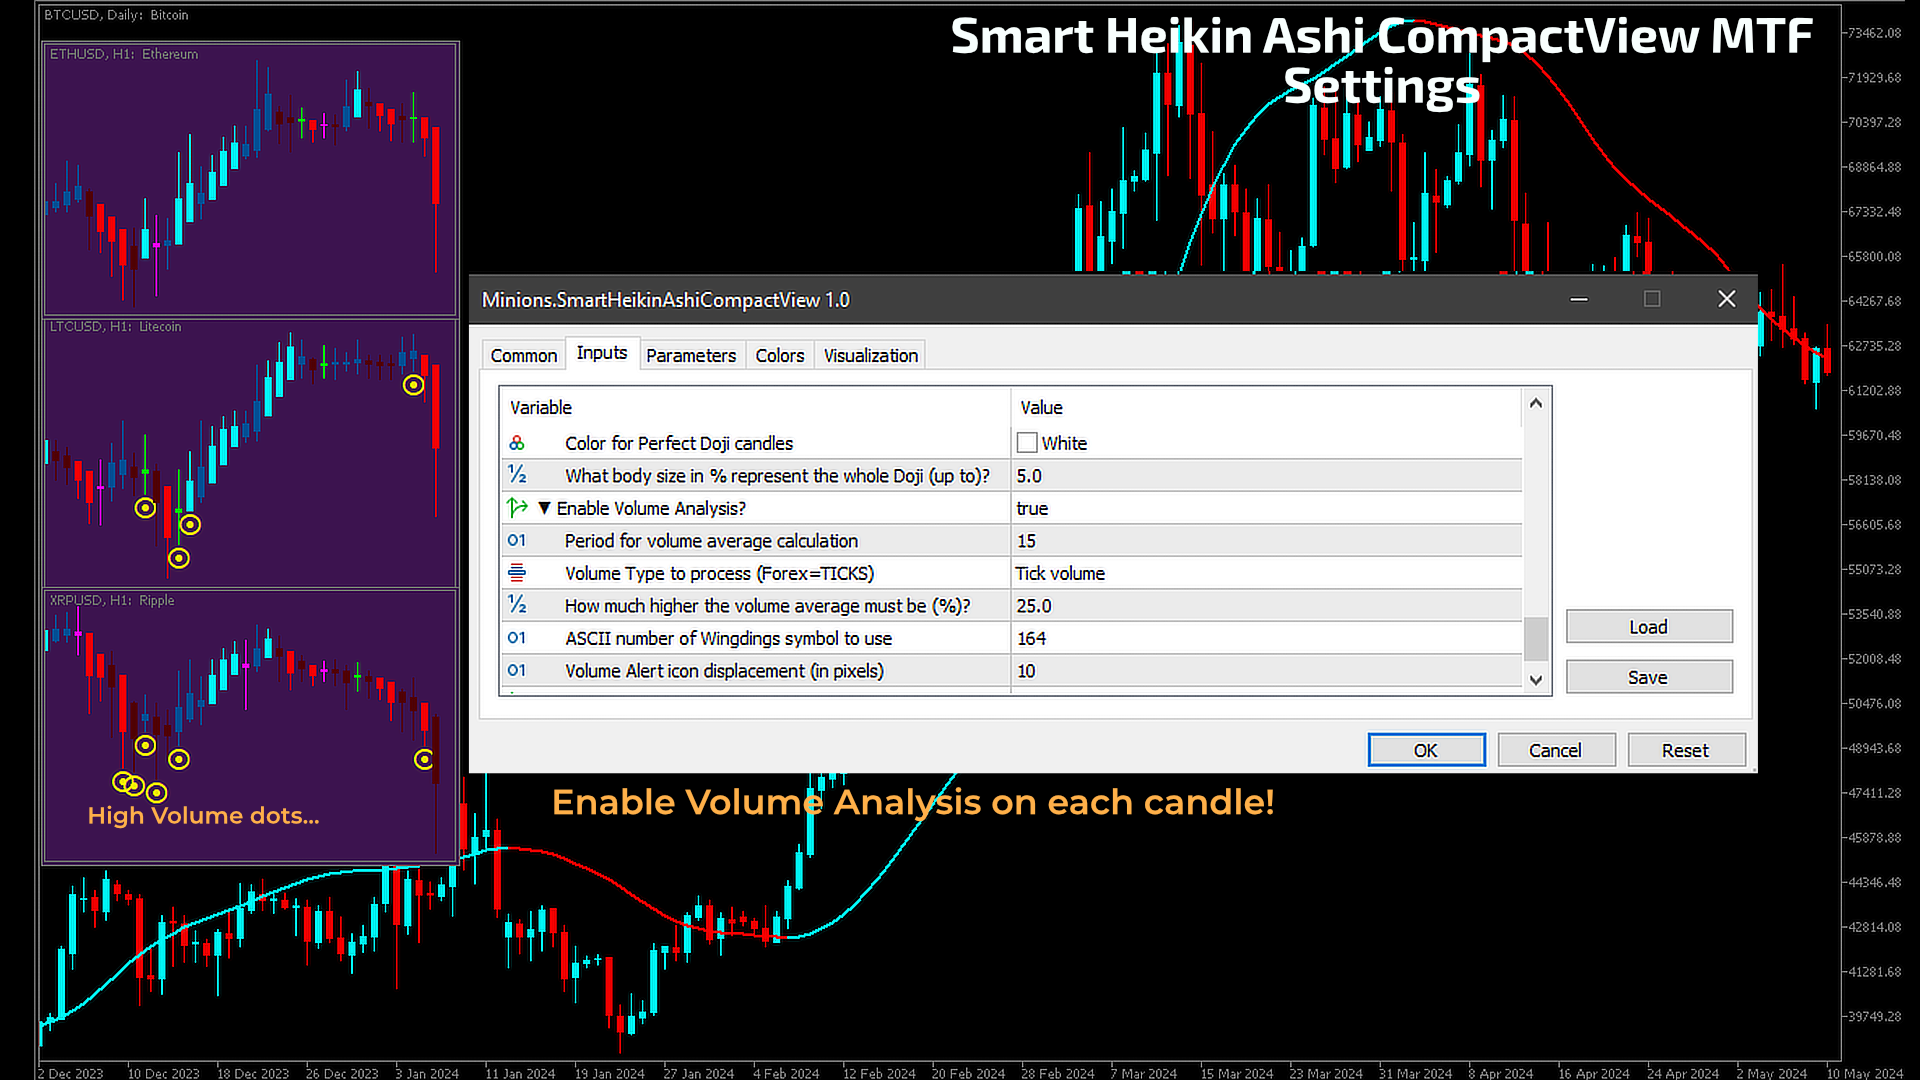
Análisis de Volumen:
- Activar Análisis deVolumen: Active o desactive la función de análisis de volumen.
- Configuración de Volumen:
- Período para el cálculo del promedio de volumen.
- Tipo de volumen a procesar (por ejemplo, Forex=TICKS, o Volumen REAL).
- Porcentaje de incremento requerido sobre el volumen medio para las alertas.
- Número ASCII del símbolo Wingdings para las alertas de volumen.
- Desplazamiento de píxeles para el icono de alerta de volumen.
Varios:
- Mensajes de Registro Experto: Elija si desea mostrar mensajes de registro en la pestaña EXPERTOS.
¿No ha encontrado la función que necesita?
Ninguna herramienta es única. Si hay alguna función que echa en falta en Smart Heikin Ashi, no dude en ponerse en contacto con nosotros. Su opinión es muy valiosa para mejorar nuestra oferta.
Acerca de Minions Labs
Minions Labs, fundada por Flavio Jarabeck, se ha comprometido a mejorar las capacidades de los operadores profesionales a través de avanzados robots de trading e indicadores. Explore estrategias de vanguardia en diversos mercados y activos con nuestras soluciones a medida.