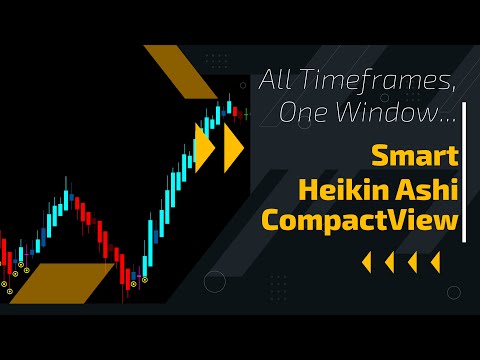
Smart Heikin Ashi CompactView MTF
- 지표
-
Flavio Javier Jarabeck
 We are a closed brotherhood of traders whose ultimate goal is to profit through well-studied, structured, and automated trades. As a result, we publish dozens of MT5 indicators (FREE and paid) to the global MQL5 community. 80% of our published products are high-quality free indicators so beginner
 - 버전: 1.0
- 활성화: 20
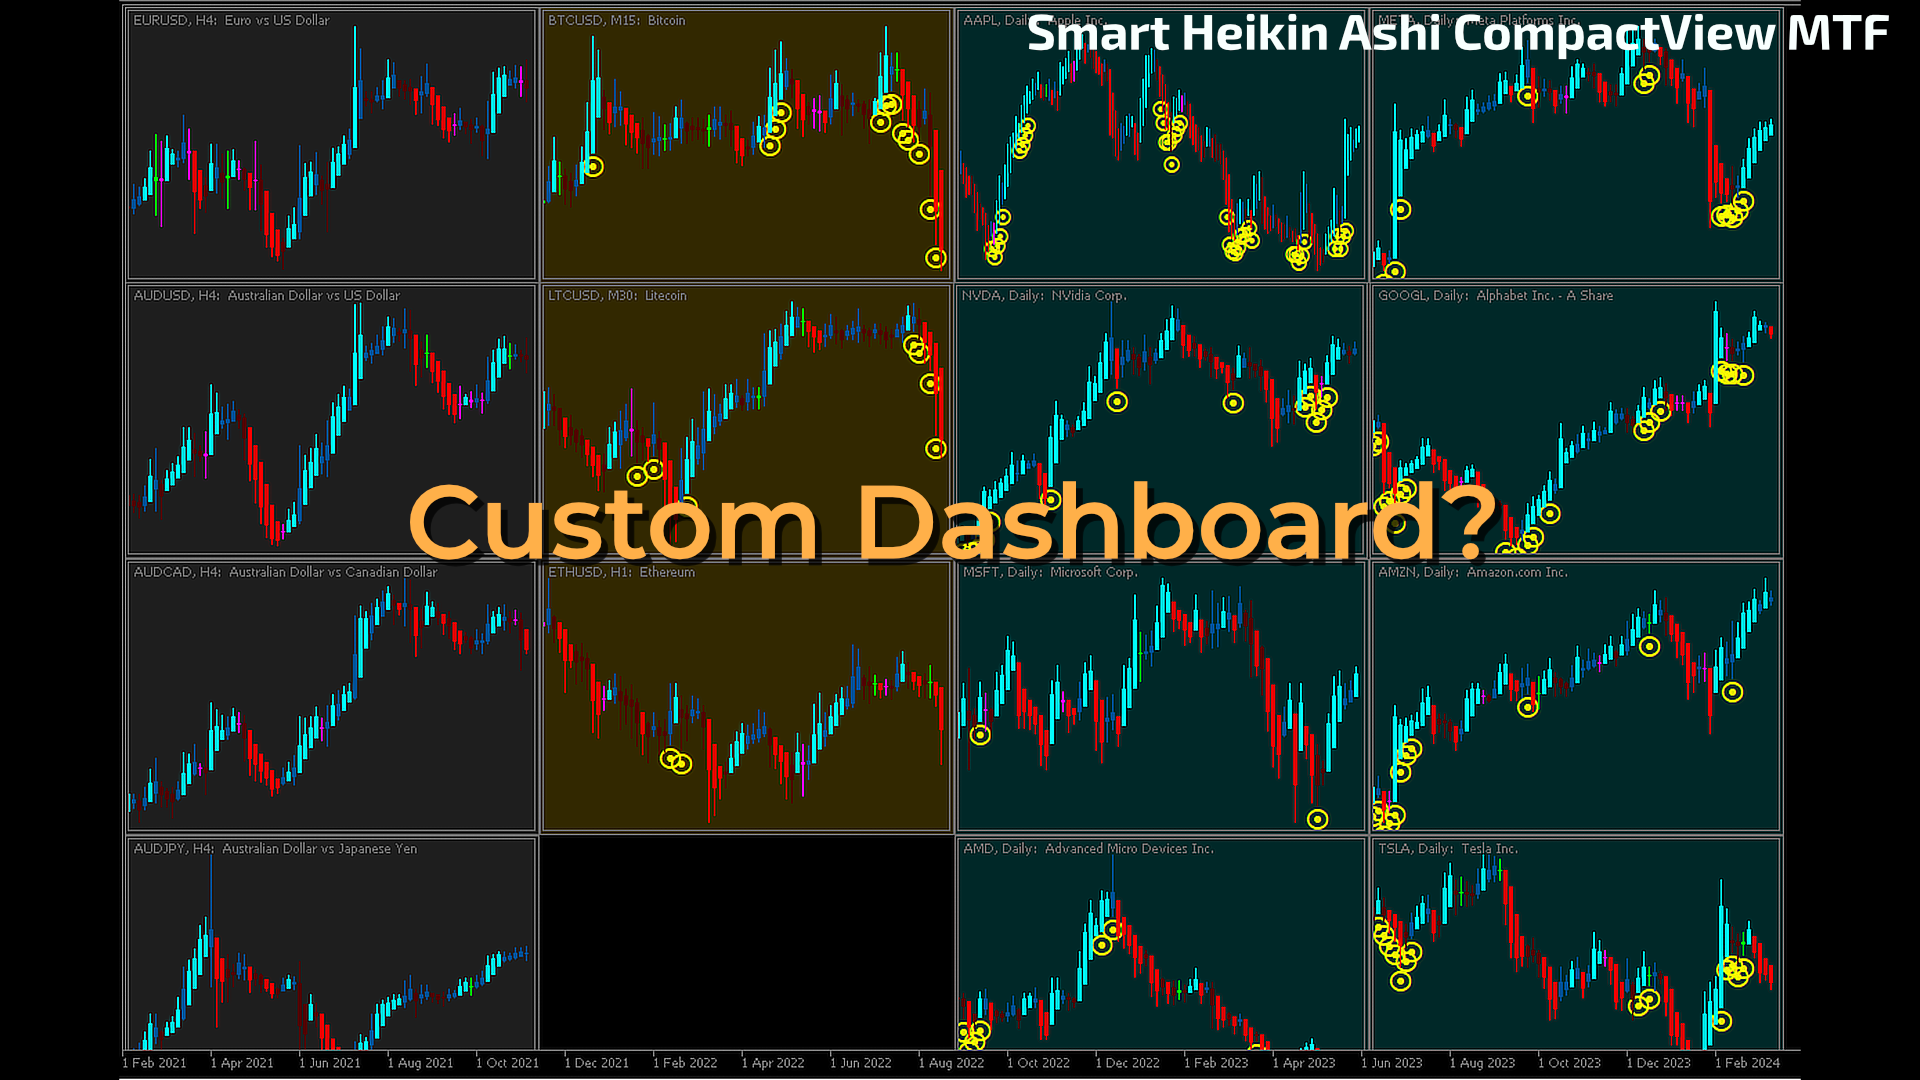
Are you already a fan of the Minions Labs Smart Heikin Ashi chart analysis tool? Or perhaps you're looking for a versatile Heikin Ashi chart capable of operating across multiple timeframes? Want to see the bigger picture before diving into the details, to make smarter ENTRY decisions? Do you want to build your own Dashboard of Symbols in just one chart, without dealing with messy multi-window MT5 stuff?
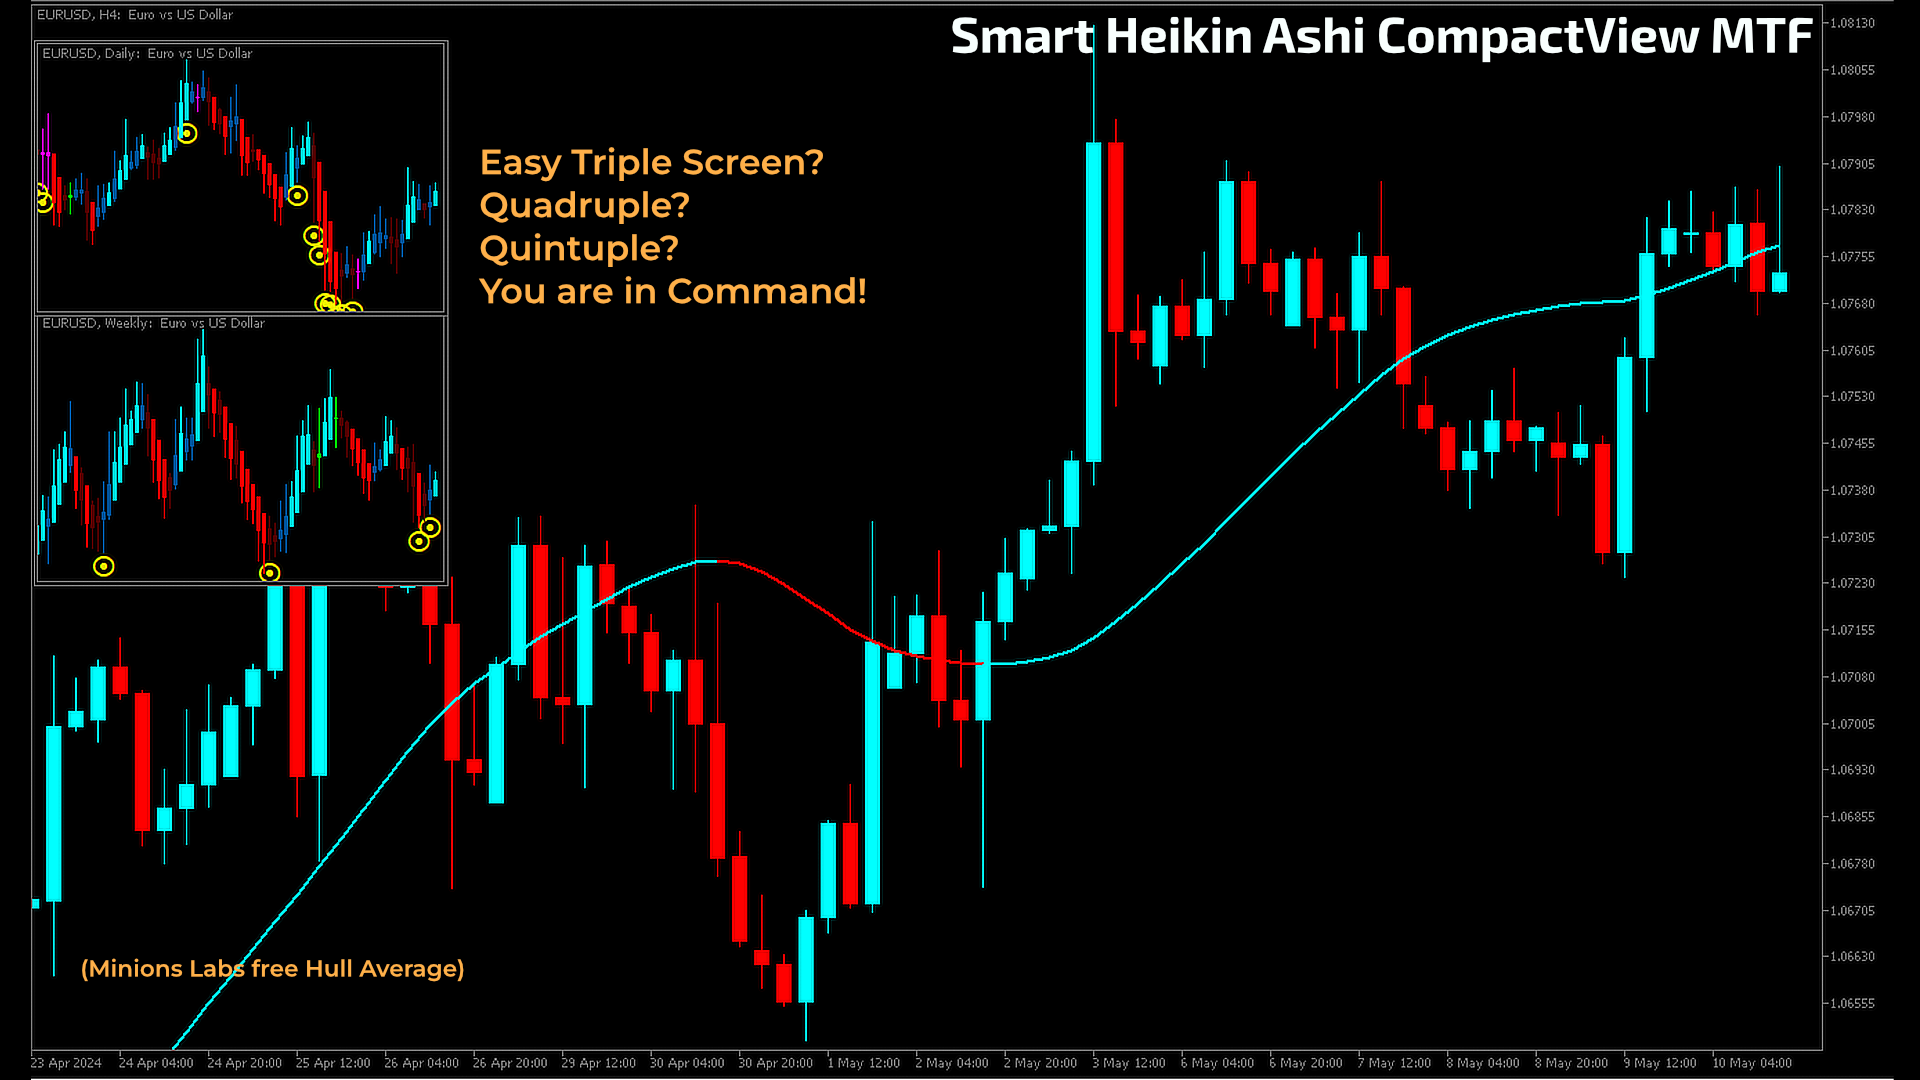
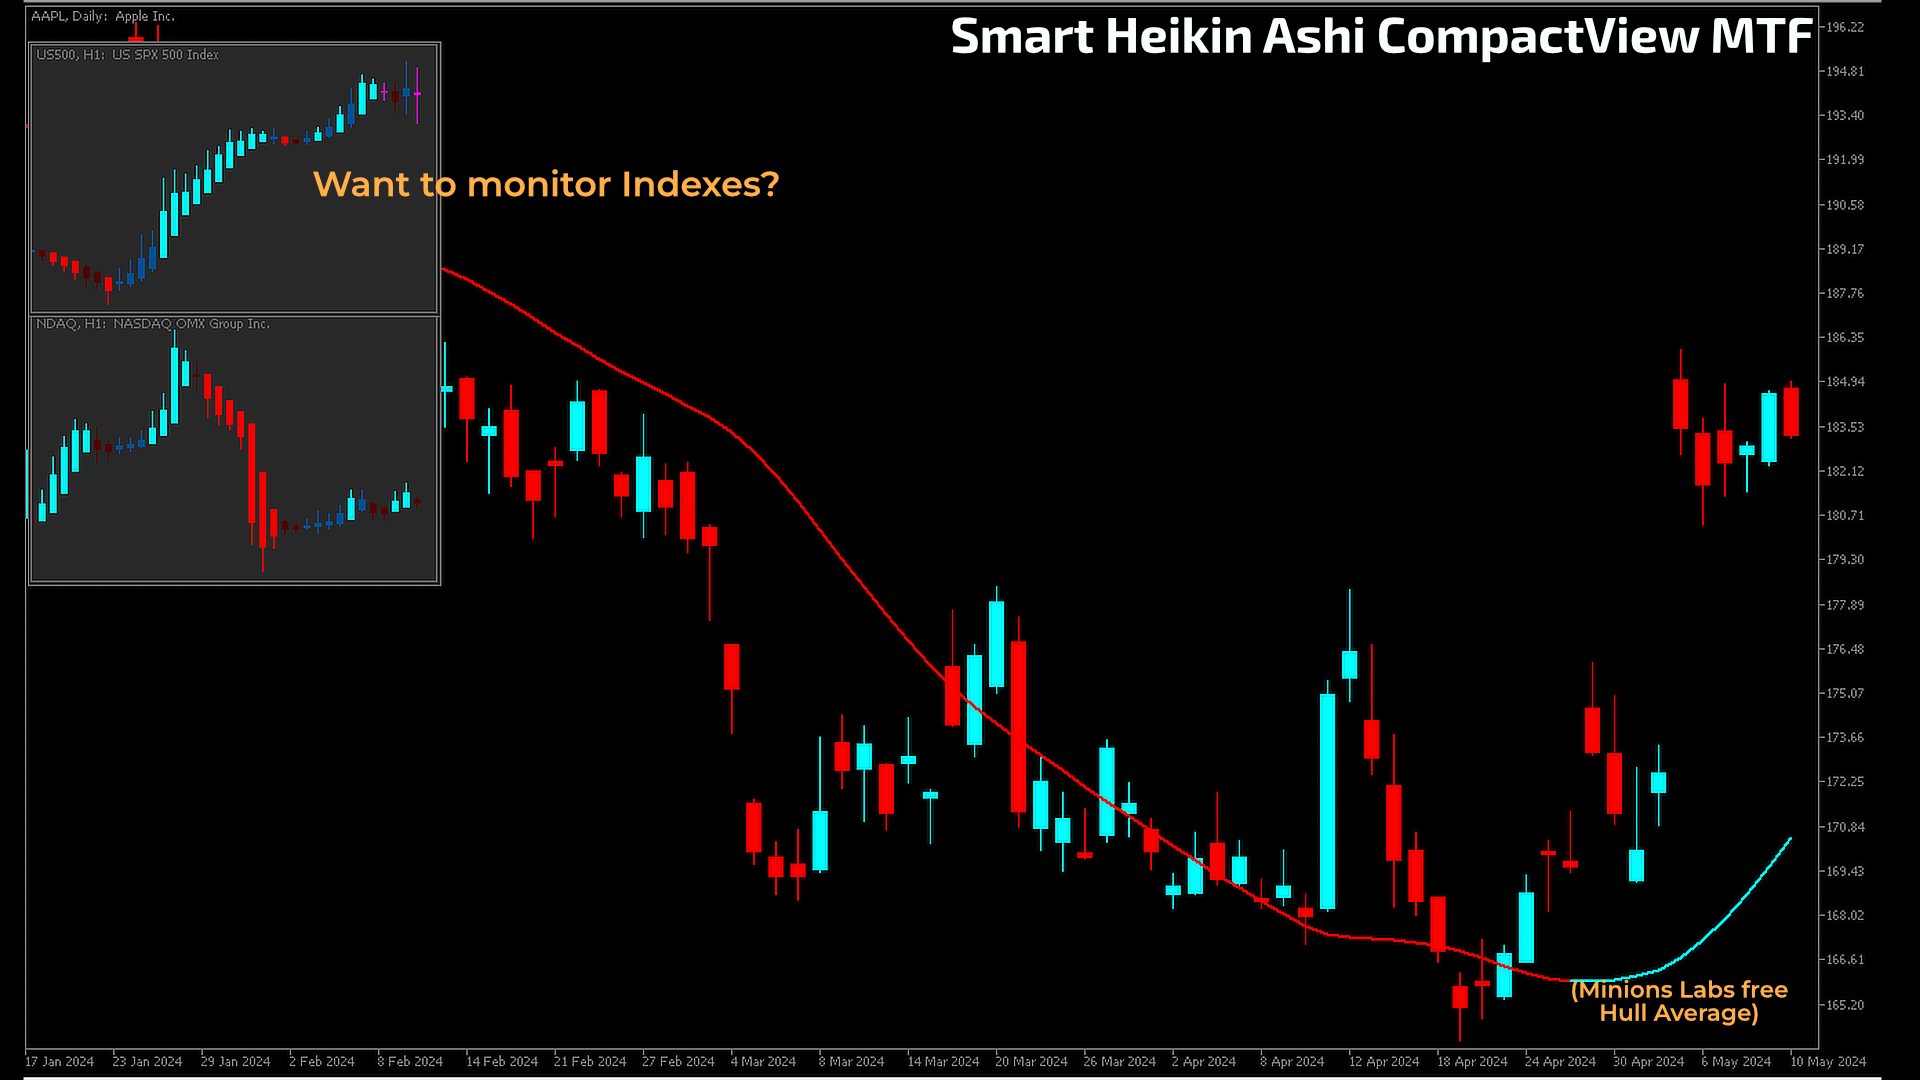
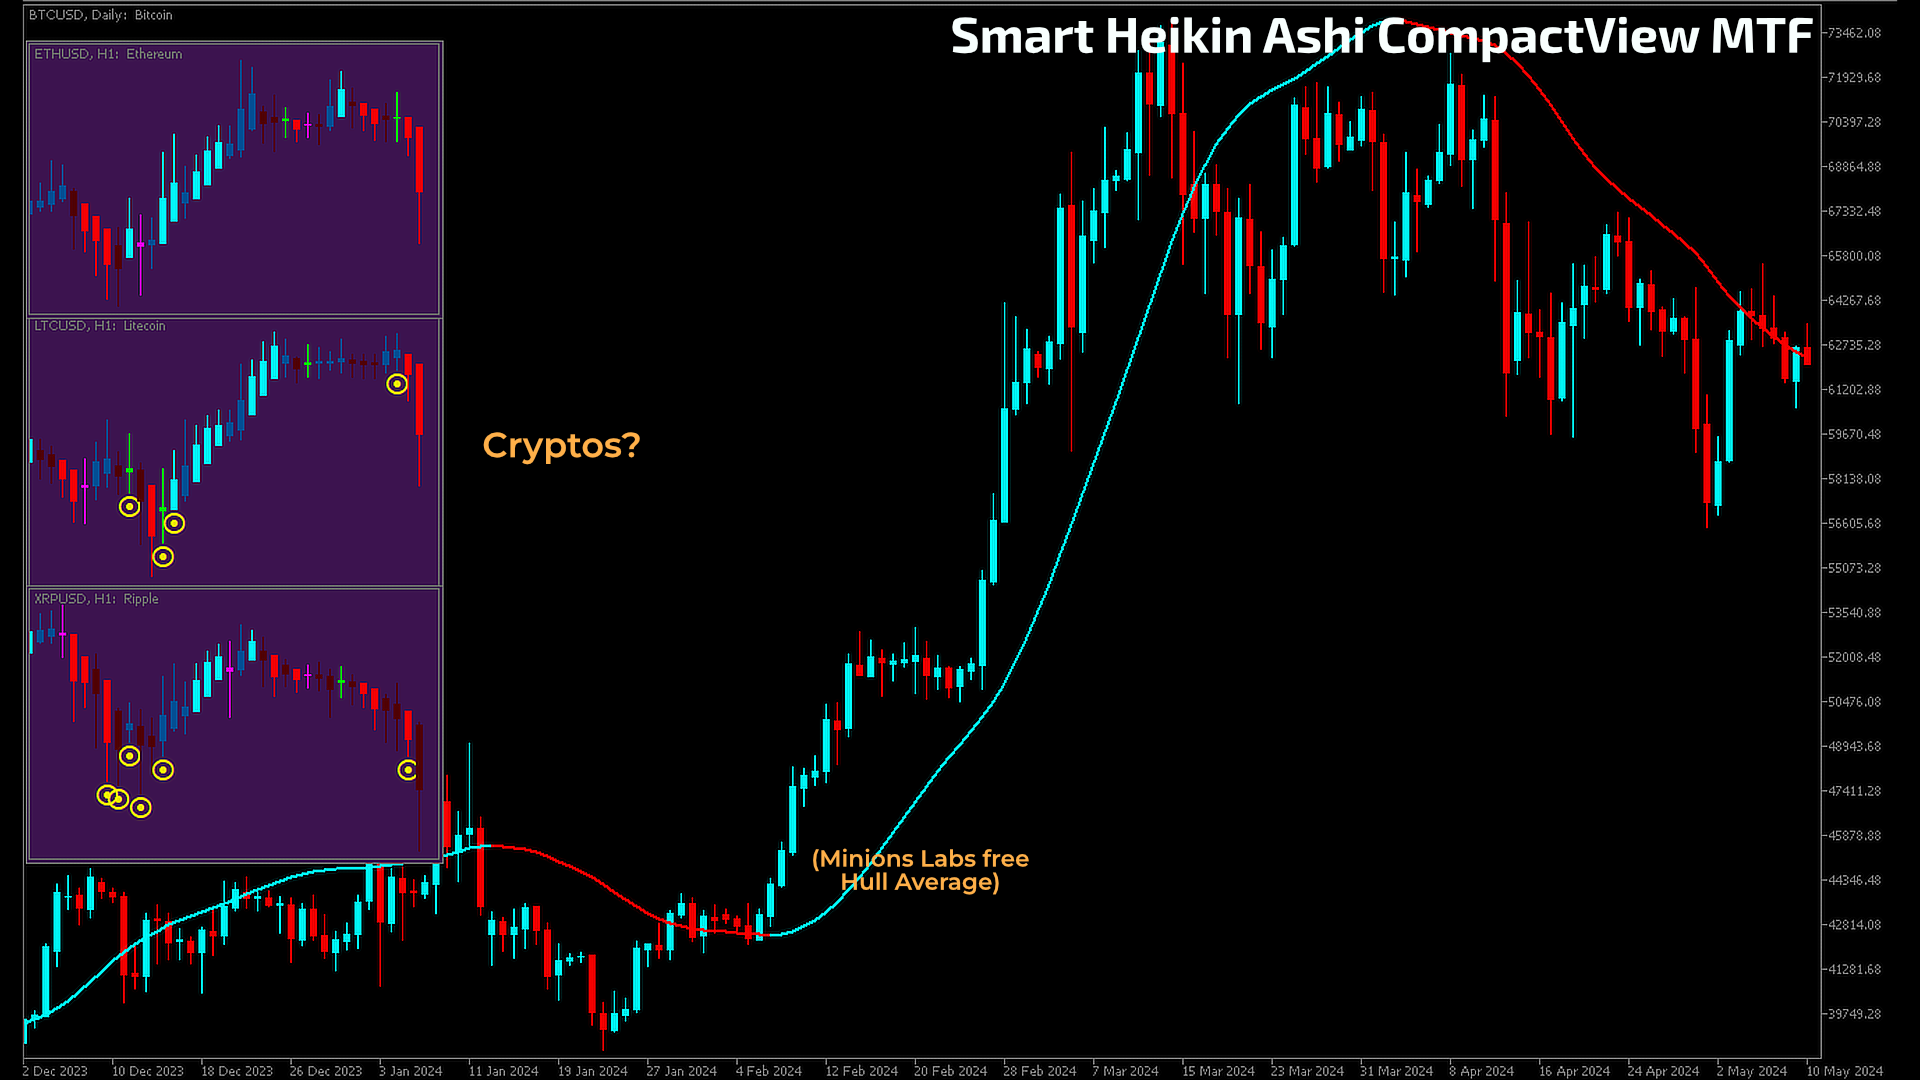
Welcome to the Minions Labs Smart Heikin Ashi CompactView MTF indicator! Please see the power of this indicator in the screenshots below... You will be amazed!
WHY SHOULD I CARE about the Smart Heikin Ashi CompactView MTF indicator?
The Smart Heikin Ashi is an innovative tool that enhances your ability to detect significant movements, dojis, and high-volume areas on the Heikin Ashi chart. But, taking a multi-timeframe approach can be complex, and displaying it in a sub-window isn't always practical, while integrating it directly into the main chart can get cluttered. Enter the Minions Labs CompactView solution!
HOW DOES THE Smart Heikin Ashi CompactView MTF WORK?
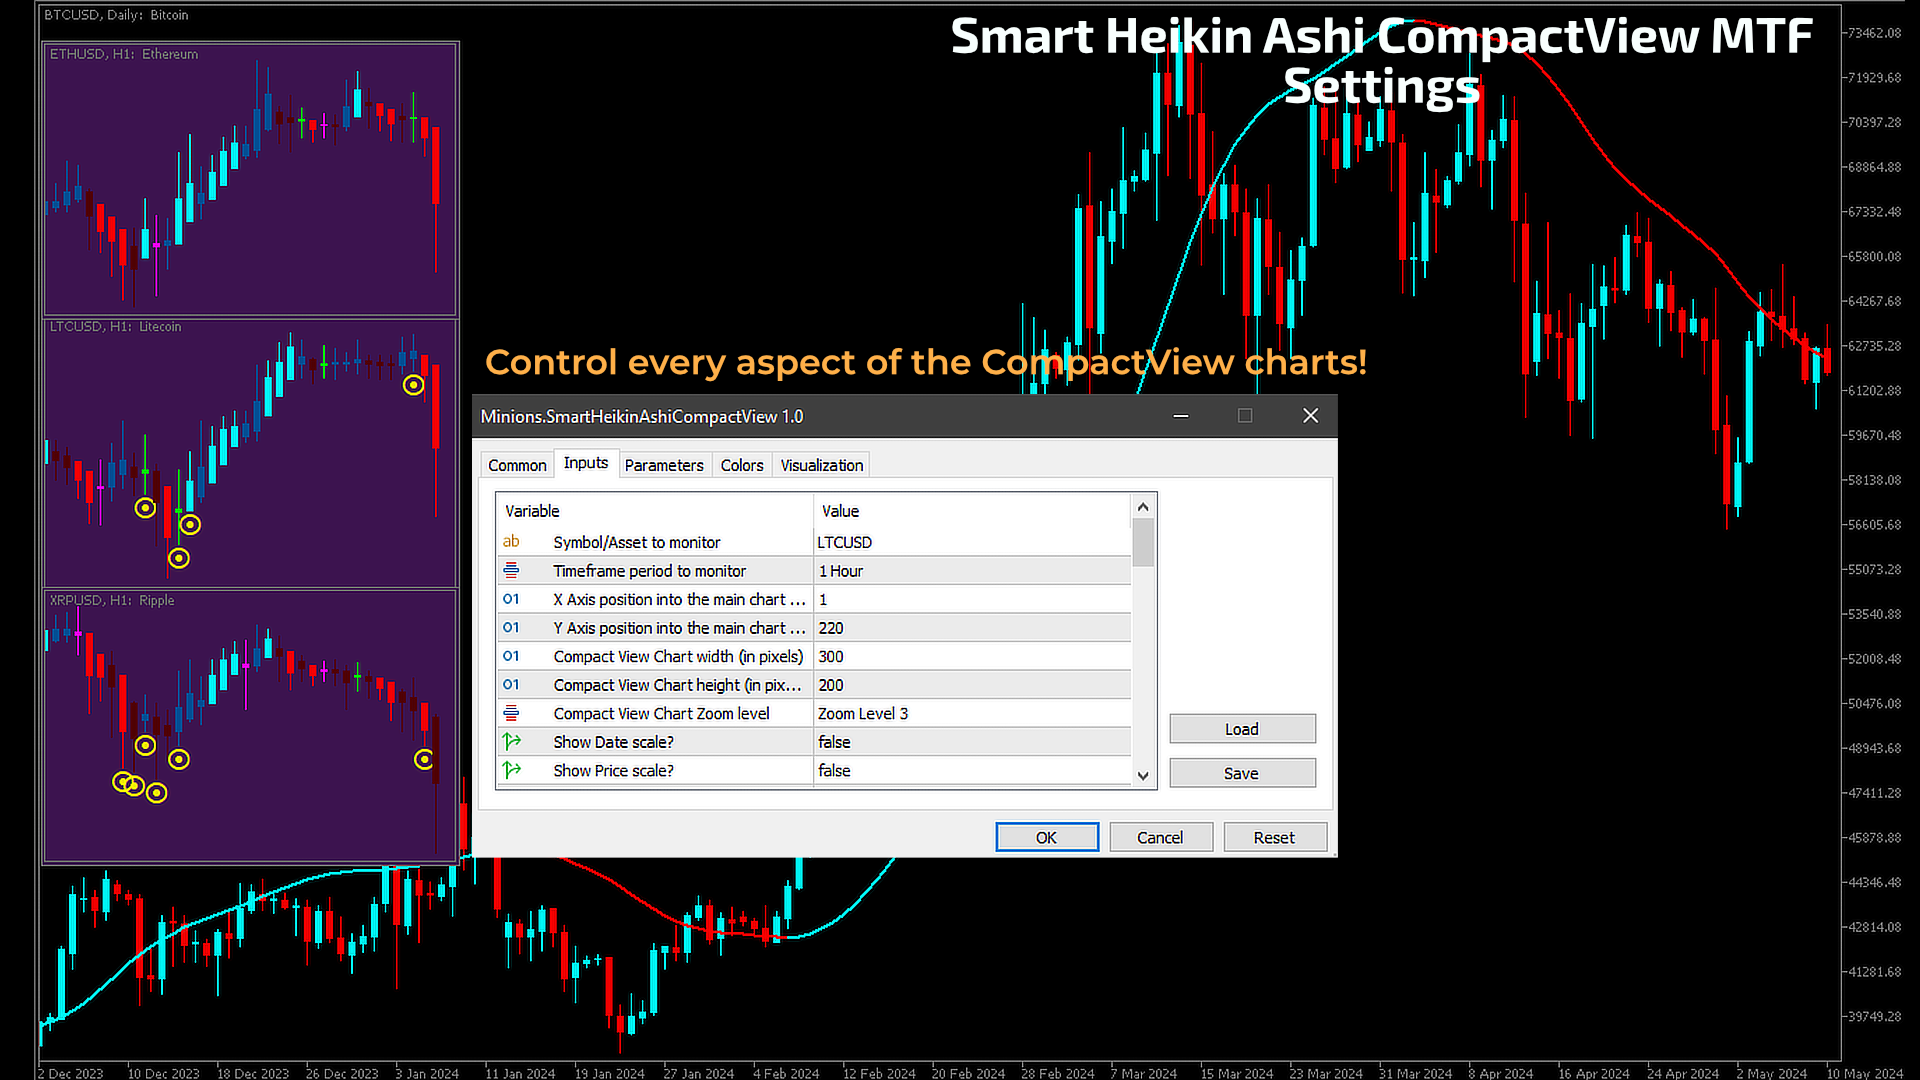
The Smart Heikin Ashi chart itself enhances your charting tools by highlighting strong movements and potential reversal points through its doji indicators. It incorporates an on-chart High Volume alert to highlight significant trading volumes and offers customizable parameters to define what constitutes a Doji. The CompactView feature allows you to set your OWN timeframe on the asset in a floating window positioned wherever you want! Customize the size and color scheme to fit your trading style!
Every aspect of this indicator is fully customizable! Cool, isn't it?
No MT5 Hacks! Just pure and highly creative and optimized MQL5 code to deliver what you need. Period.
We at Minions Labs push MT5 to its limits, you know that from our other products. And, if you don't know us yet, feel free to visit our dozens of products, Free and Paid... https://www.mql5.com/en/users/fjarabeck/seller
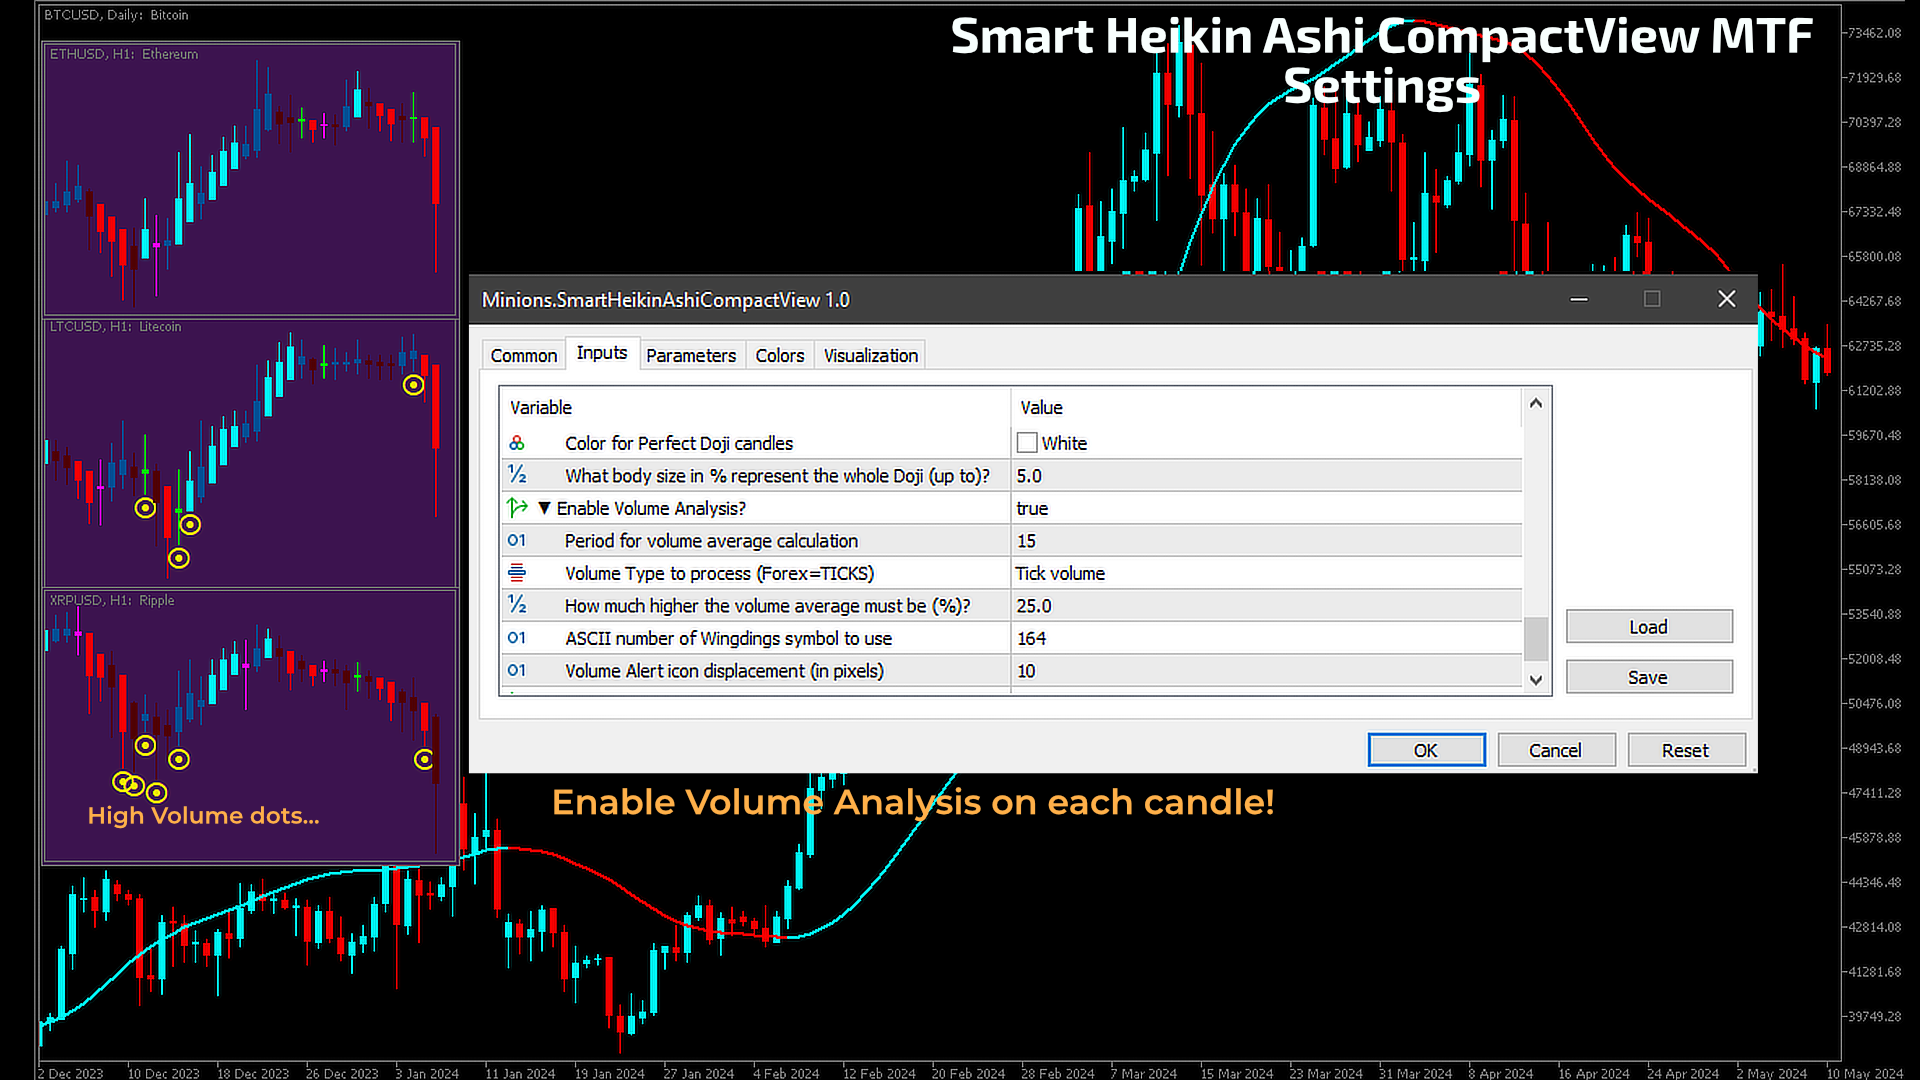
SETTINGS
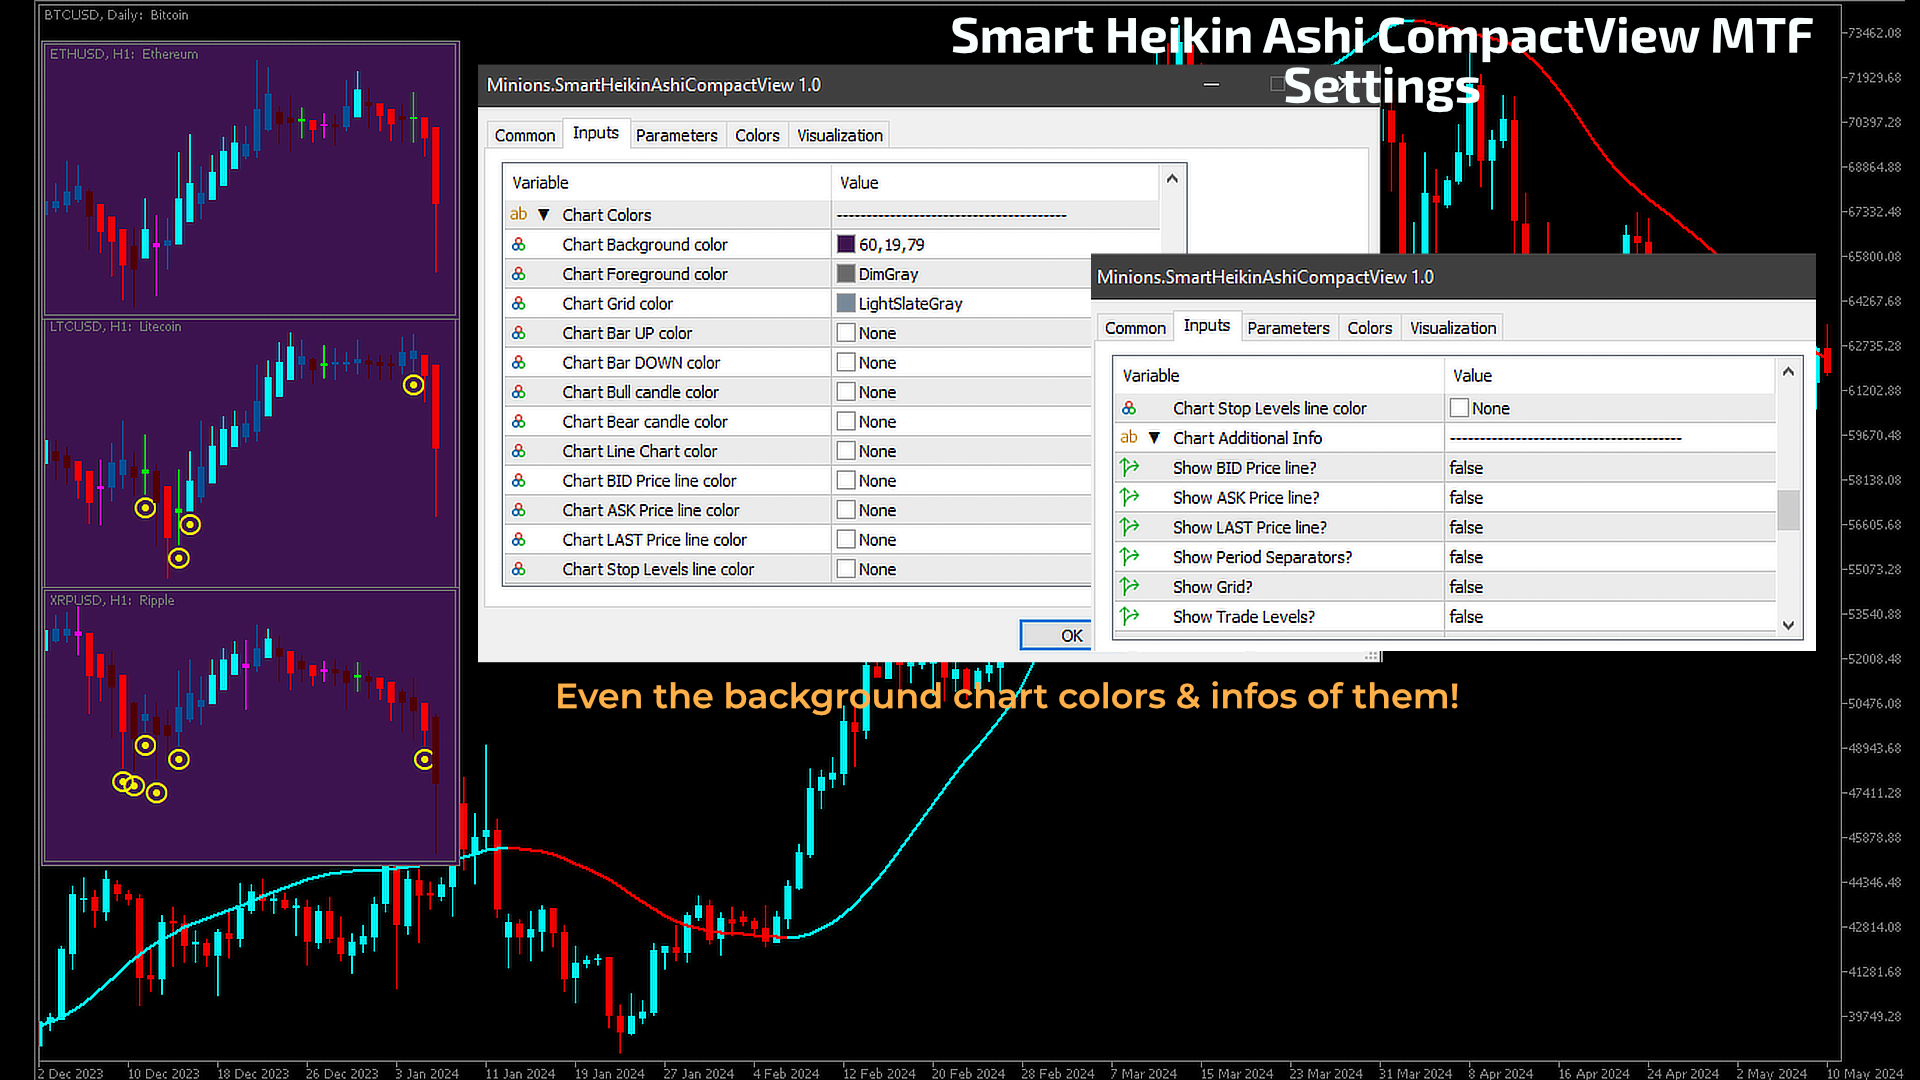
General Chart Settings:
- Chart Colors: Adjust the background, foreground, grid, bar UP/DOWN, bull/bear candle, line chart, BID/ASK/LAST price line, and stop levels line colors.
Display Options:
- Chart Additional Info: Choose to display BID, ASK, LAST price lines, period separators, grid, and trade levels.
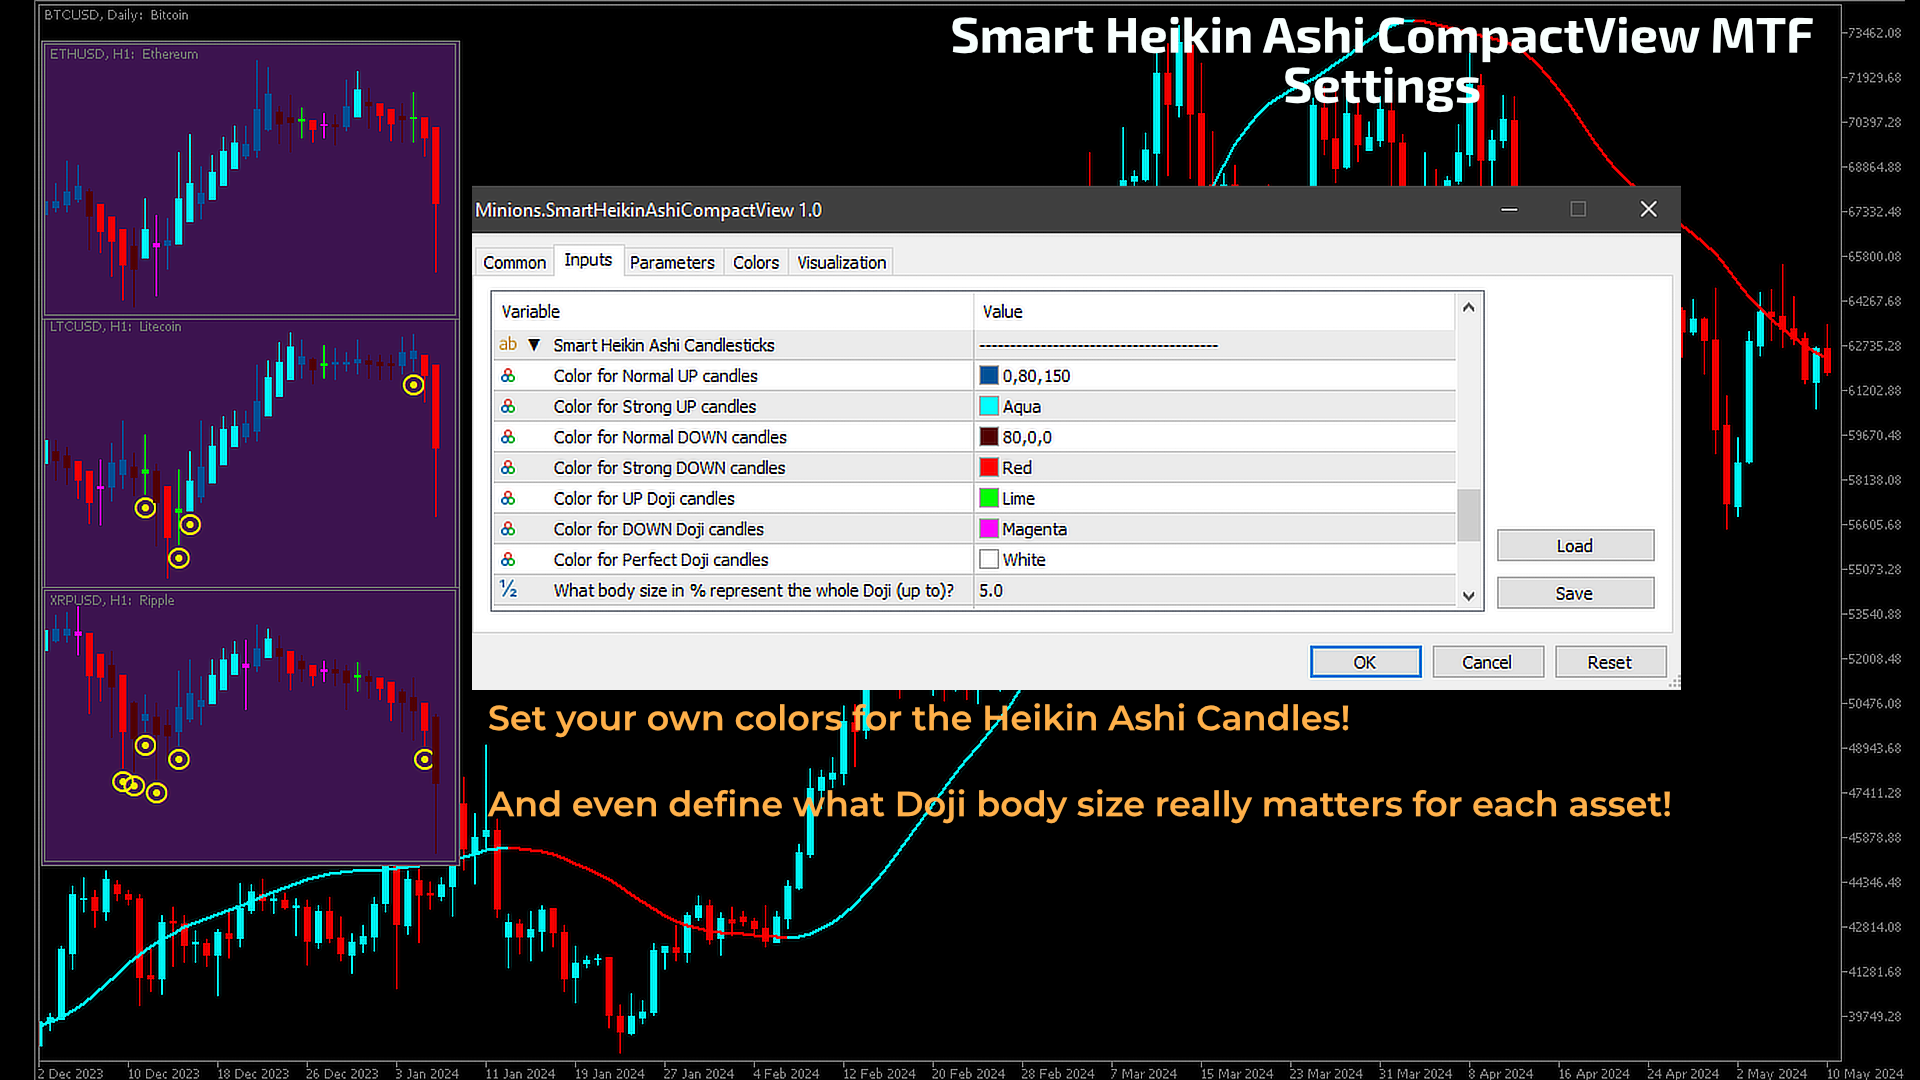
Smart Heikin Ashi Candlesticks Settings:
- Candle Colors: Set colors for Normal UP, Strong UP, Normal DOWN, Strong DOWN, UP Doji, DOWN Doji, and Perfect Doji candles.
- Doji Size Configuration: Define what body size percentage represents a Doji candle.
Volume Analysis:
- Enable Volume Analysis: Toggle the volume analysis feature on or off.
- Volume Settings:
- Period for volume average calculation.
- Volume type to process (e.g., Forex=TICKS, or REAL Volume).
- Required percentage increase over the average volume for alerts.
- Wingdings symbol ASCII number for volume alerts.
- Pixel displacement for the volume alert icon.
Miscellaneous:
- Expert Log Messages: Choose whether to show log messages on the EXPERTS tab.
Didn't Find a Feature You Need?
No tool is one-size-fits-all. If there's a feature you're missing in the Smart Heikin Ashi, don't hesitate to contact us. Your input is invaluable as we strive to improve our offerings!
About Us
Minions Labs, founded by Flavio Jarabeck, is committed to enhancing the capabilities of professional traders through advanced trading robots and indicators. Explore cutting-edge strategies across various markets and assets with our tailored solutions.