Hurst Cycles

Hurst Cycles is a cycle indicator for MetaTrader 5 that finds the market cycles on your chart, marks every cycle bottom and top, and shows when the next turning point is due, based on J. M. Hurst's cycle analysis with FLD buy and sell signals.

It measures the cycles from the price data of the chart it is attached to, shows where several cycles turn at the same time, gives BUY and SELL signals by Hurst's FLD rule with a target and a stop, and shows the time window of the next bottom and top of each cycle.

Why the cycles are measured, not assumed

Hurst described price as a sum of nested cycles, each about half as long as the one above it. Many cycle tools draw a fixed table of periods, for example 5, 10, 20, 40 and 80 bars, whatever the market does. This indicator starts from the data instead.

First it removes the slower movement from price with a centred moving average, as Hurst did. Then it scans every period between the shortest and the longest you set and measures how much of the movement each period explains. The peaks of that scan are the cycles the chart actually has.

Each cycle is then checked in two ways. The scan is run separately on the first and on the second half of the window: a cycle whose period moves too much between the two halves is dropped as noise. A cycle must also explain a minimum share of the movement and repeat at least three times inside the window. Up to six cycles are kept, longest first. The cycles are measured on closed daily bars and kept for the day, so the set of cycles does not change every few bars.

What you see on the chart

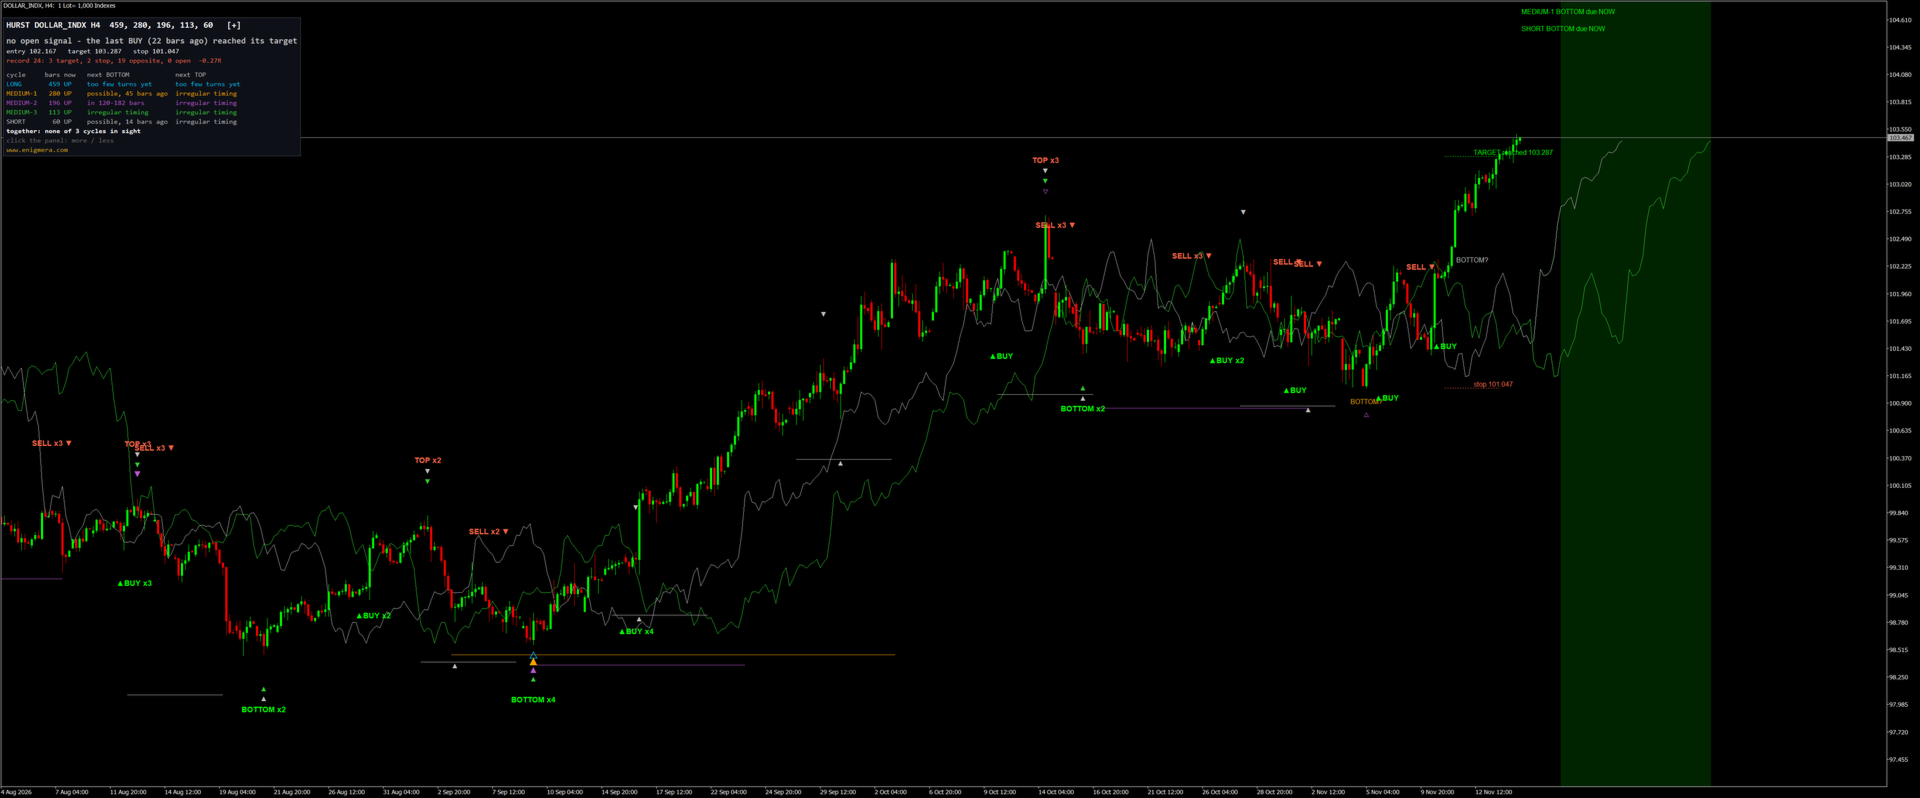
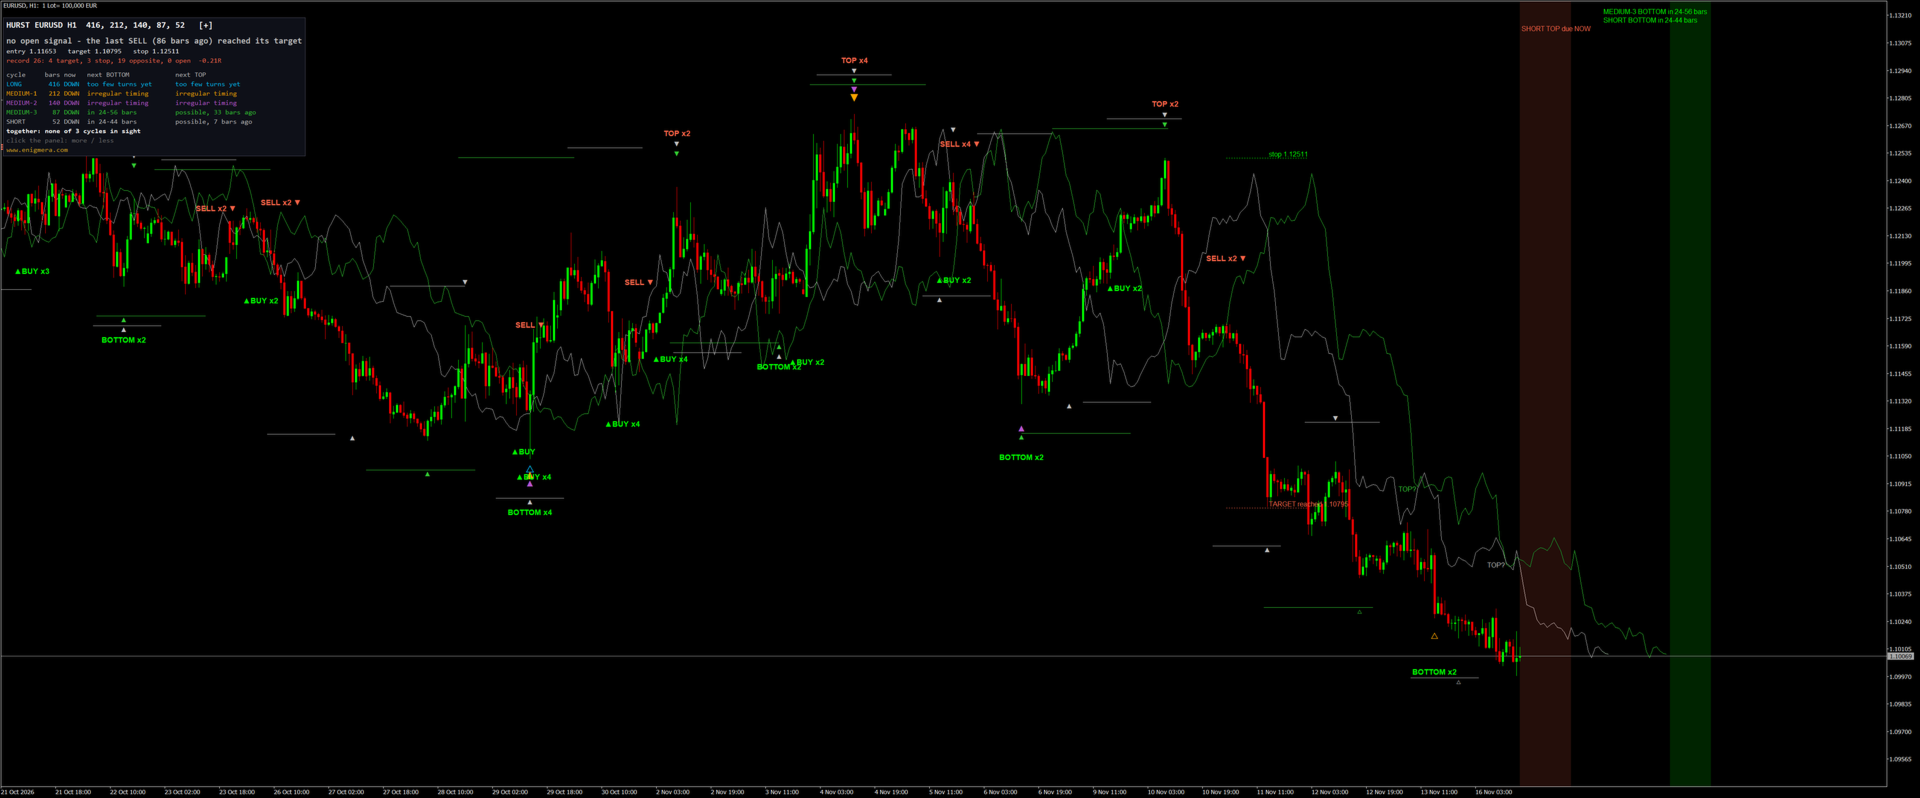
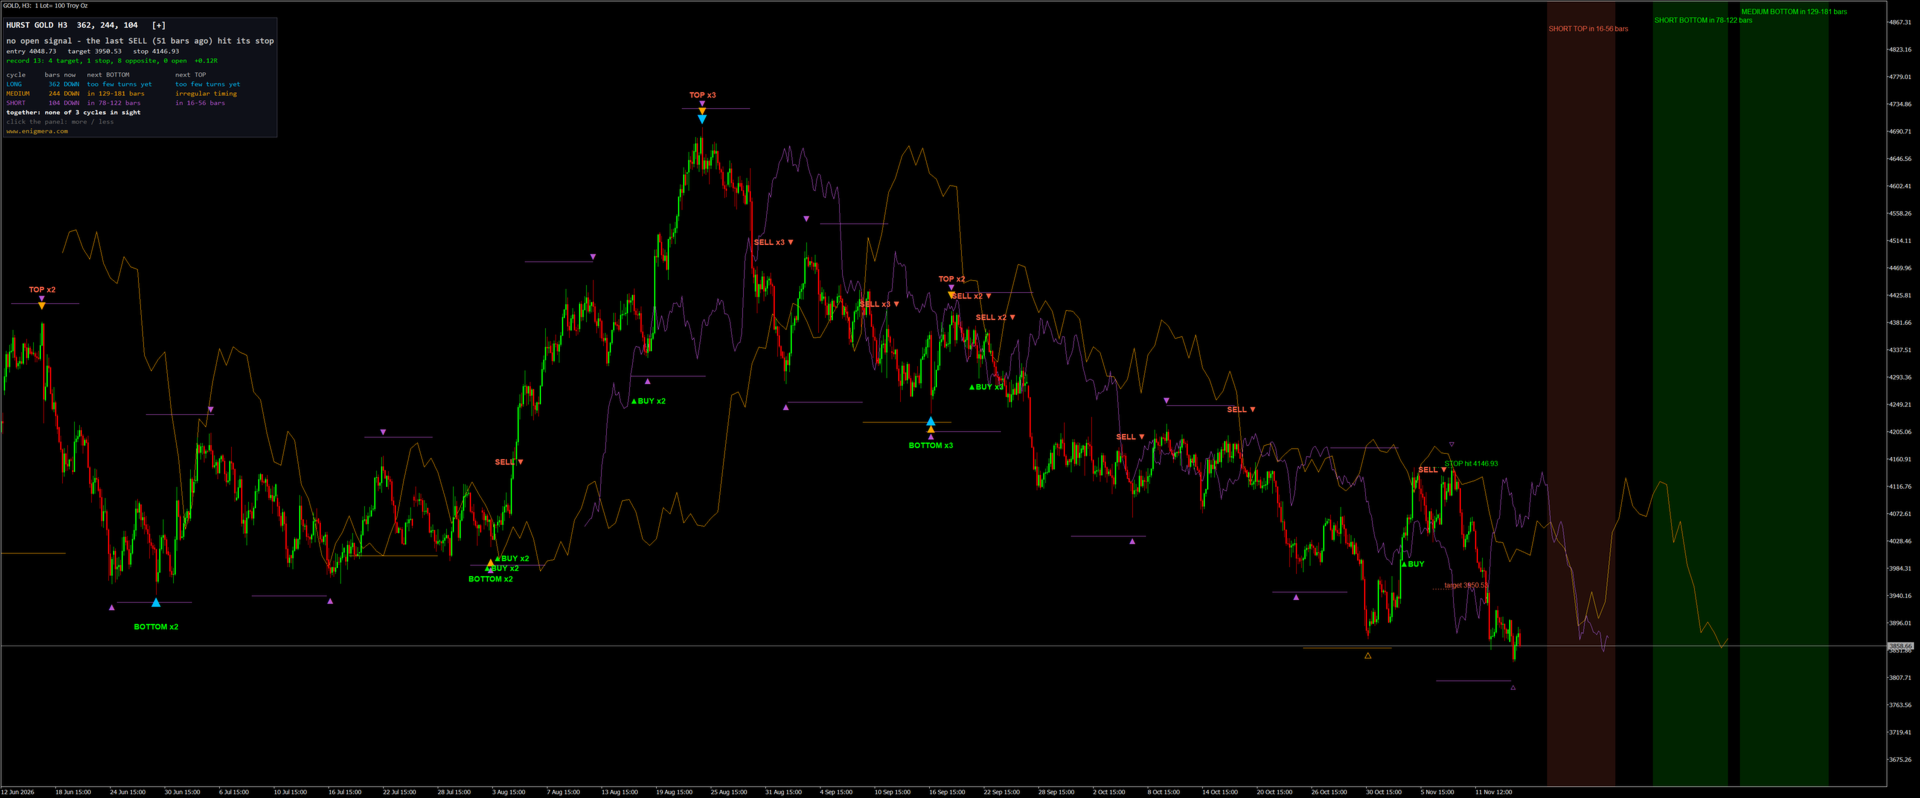
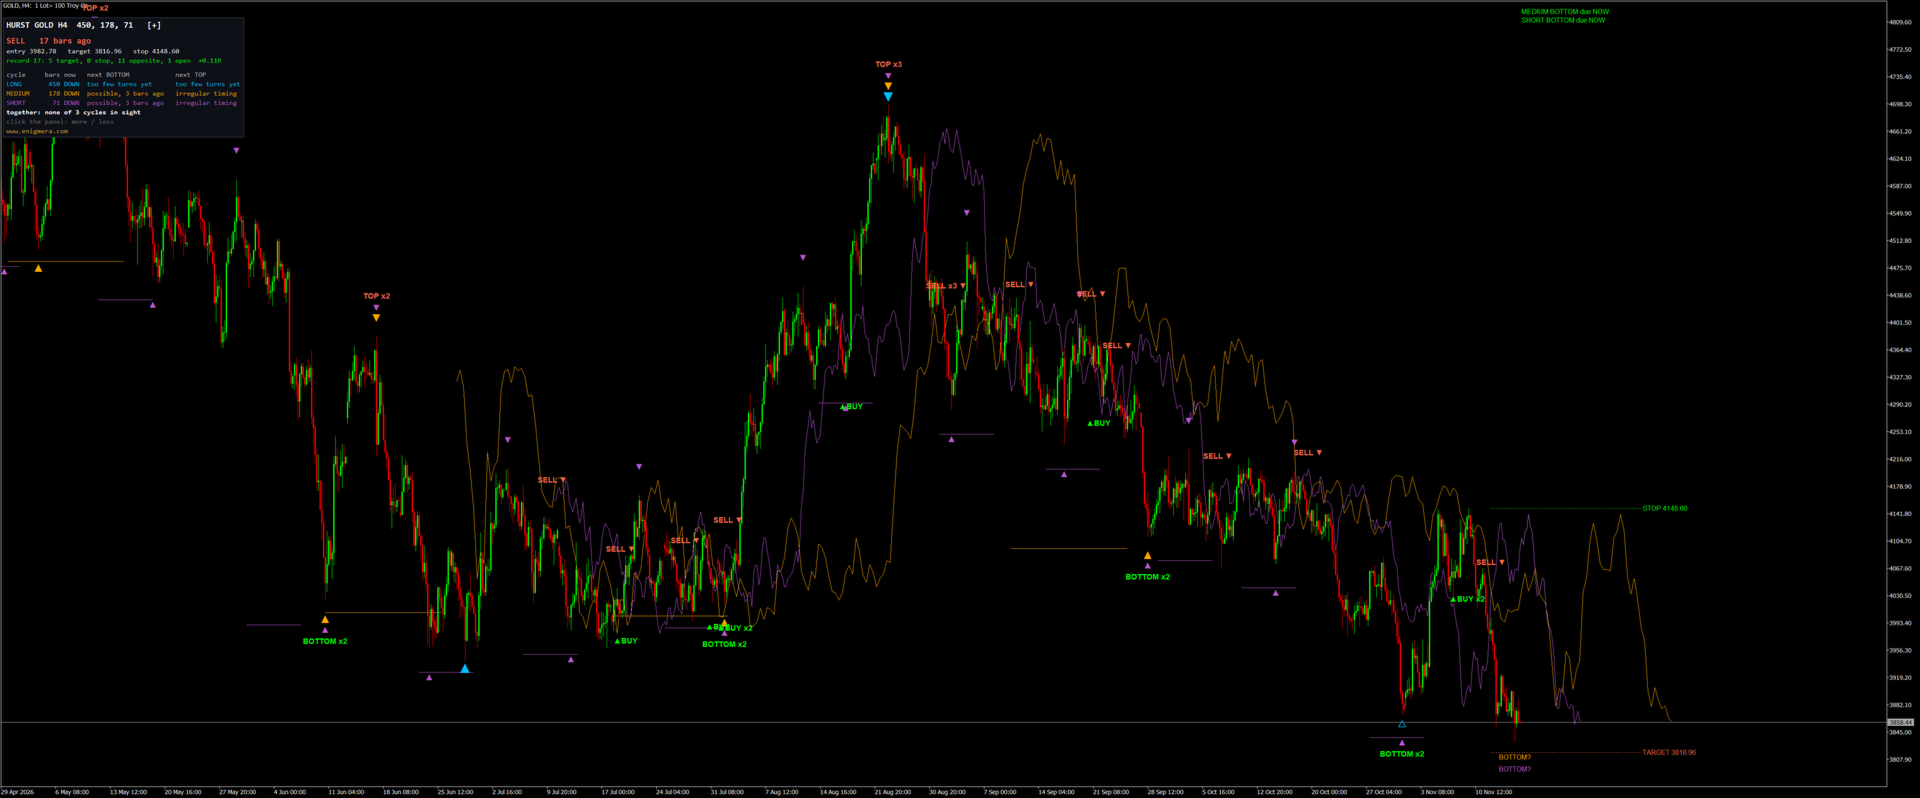
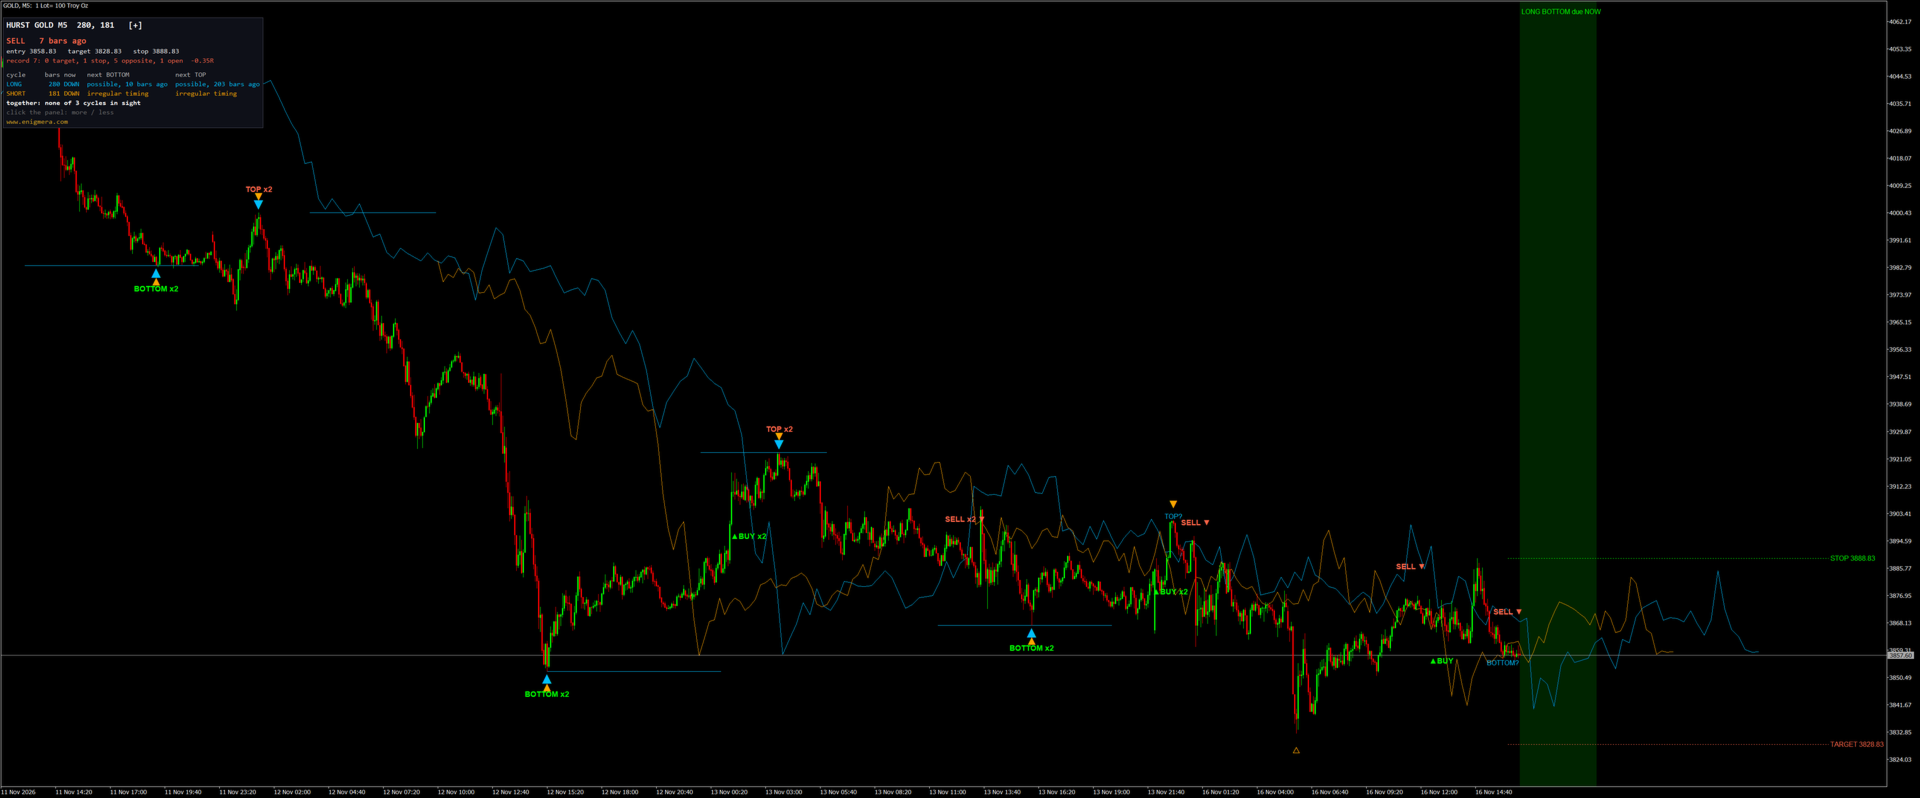
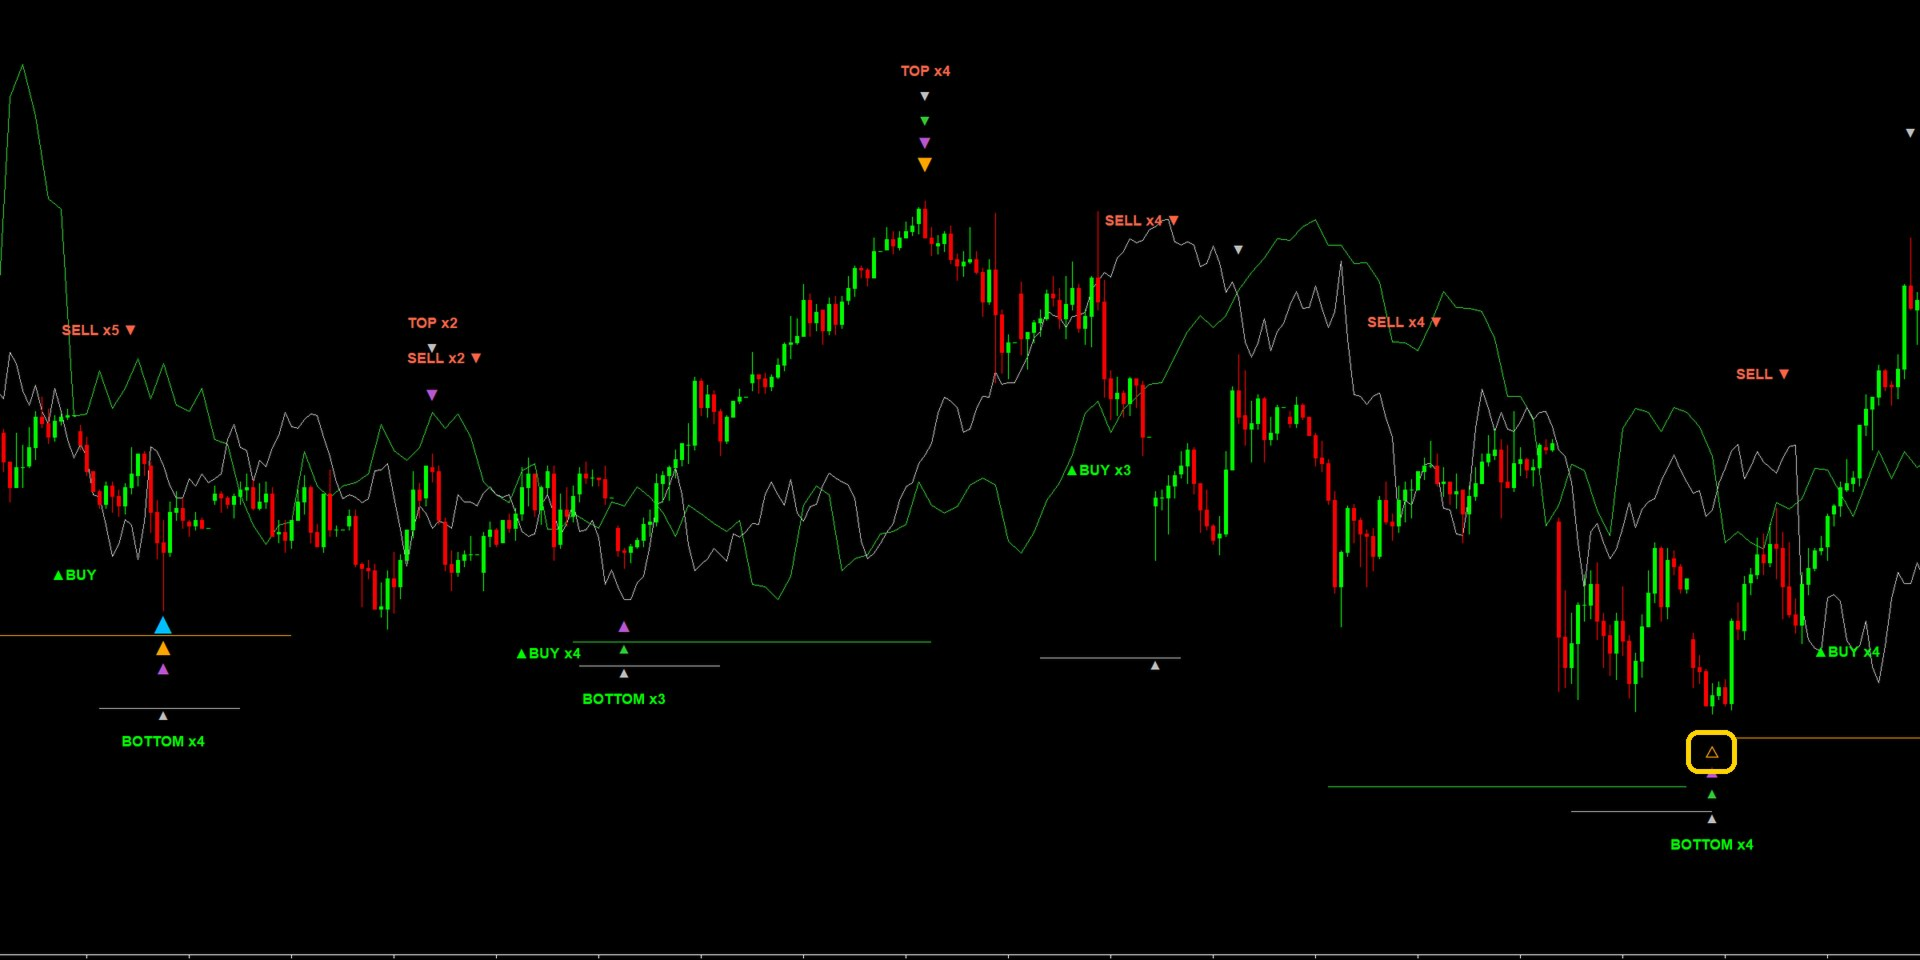
  • A mark at every bottom and every top of every cycle. The longer the cycle, the larger the mark.
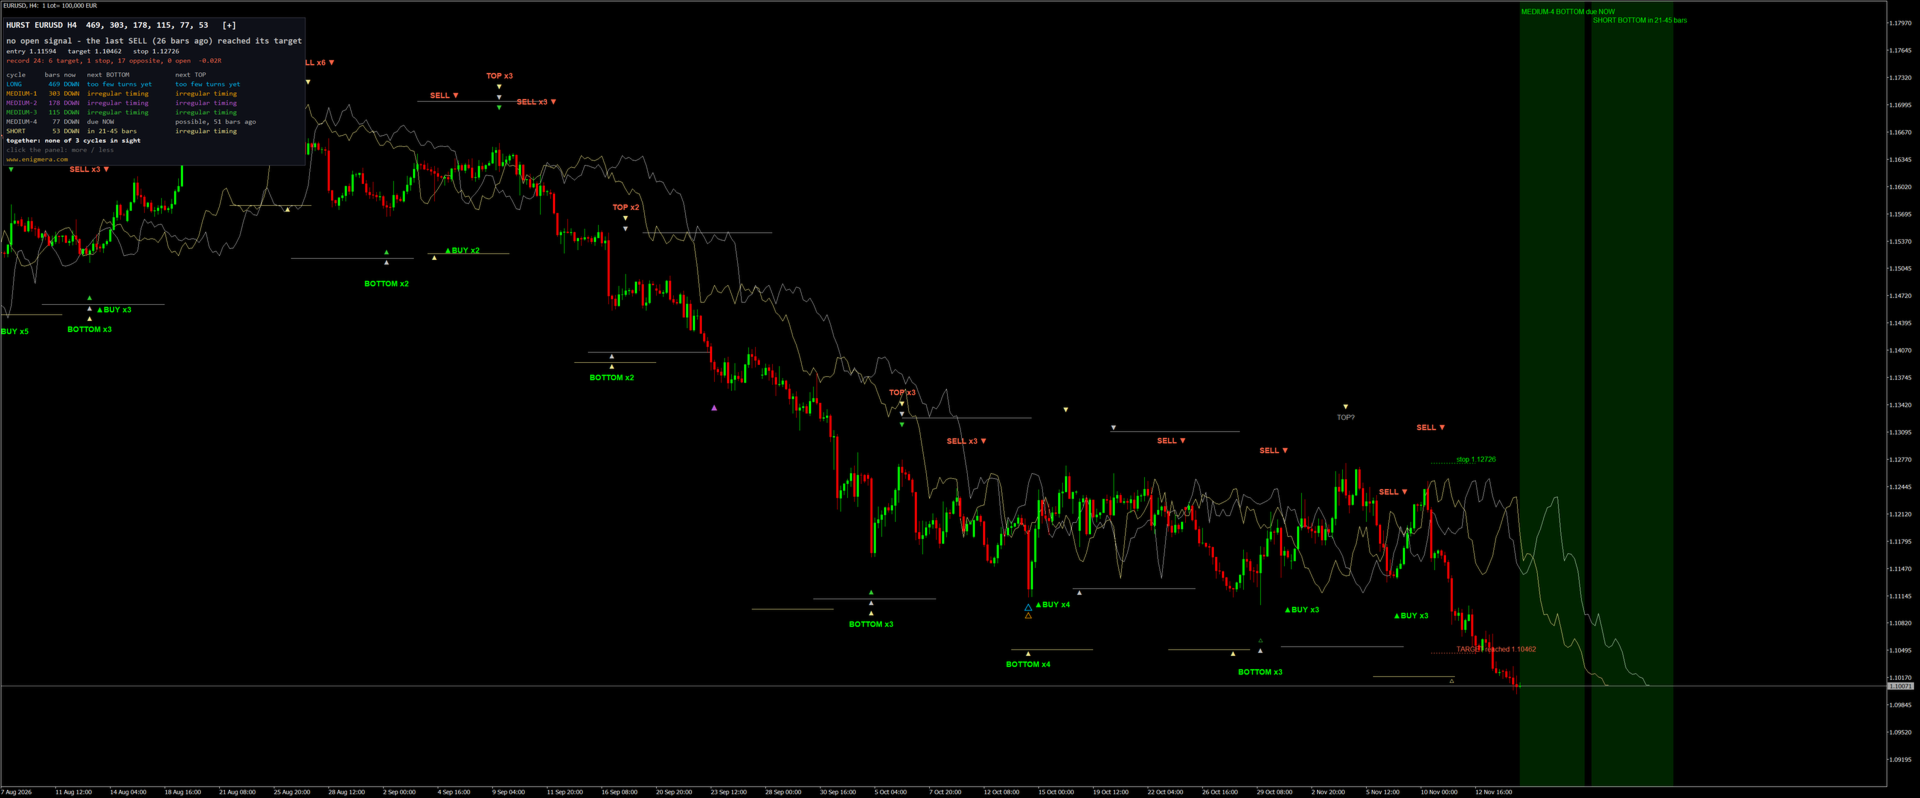
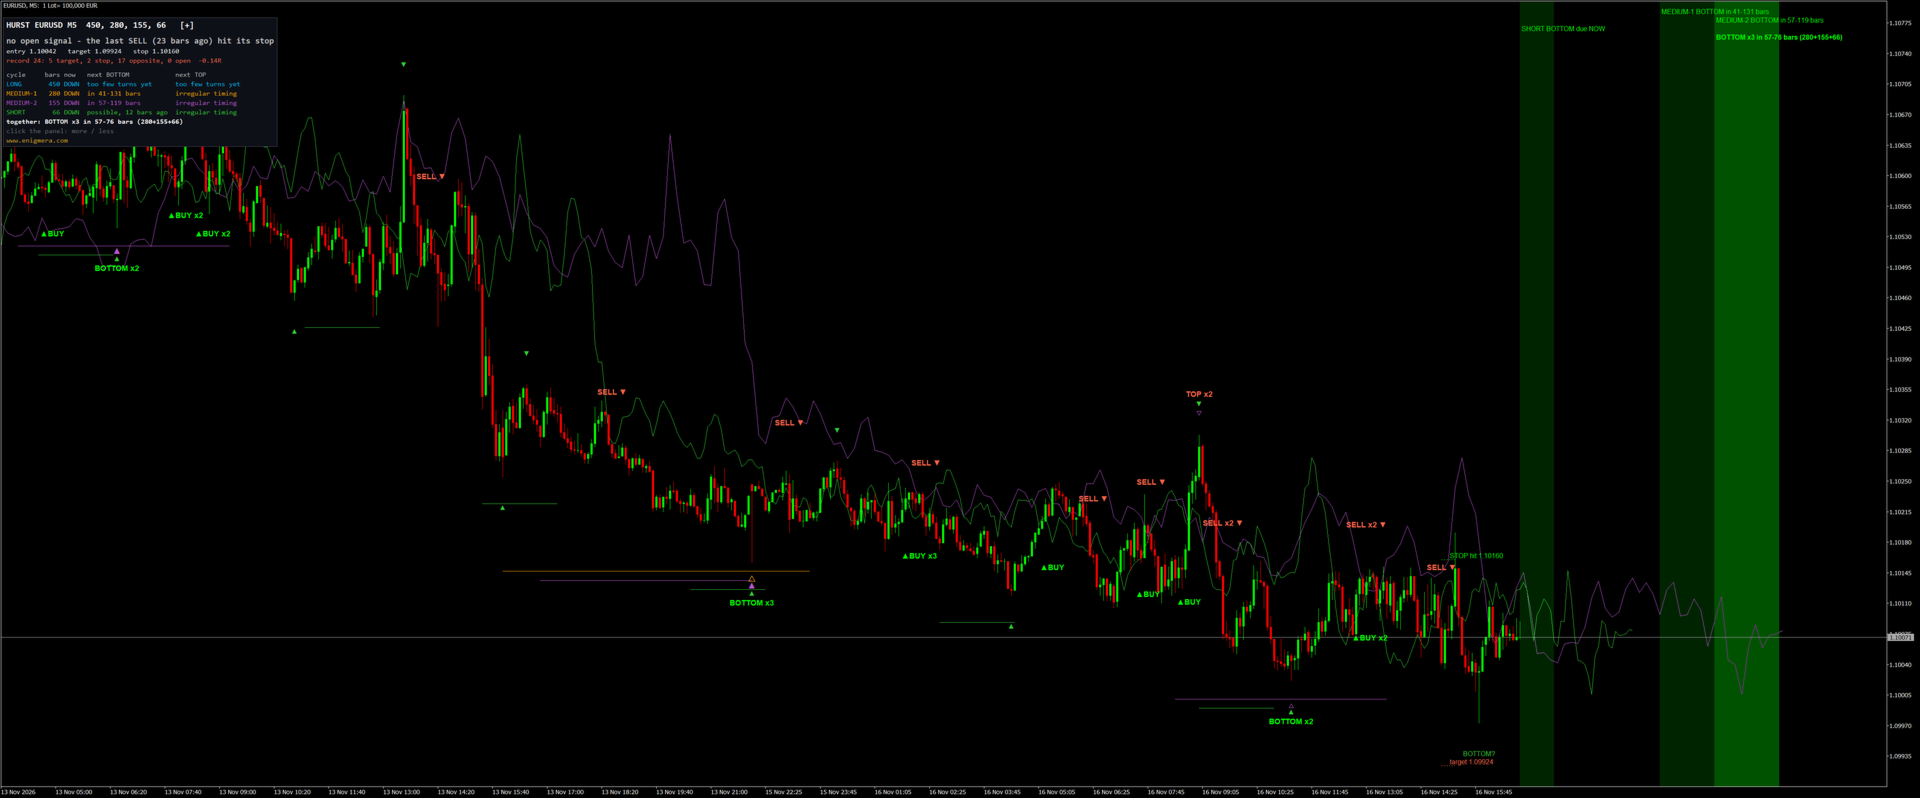
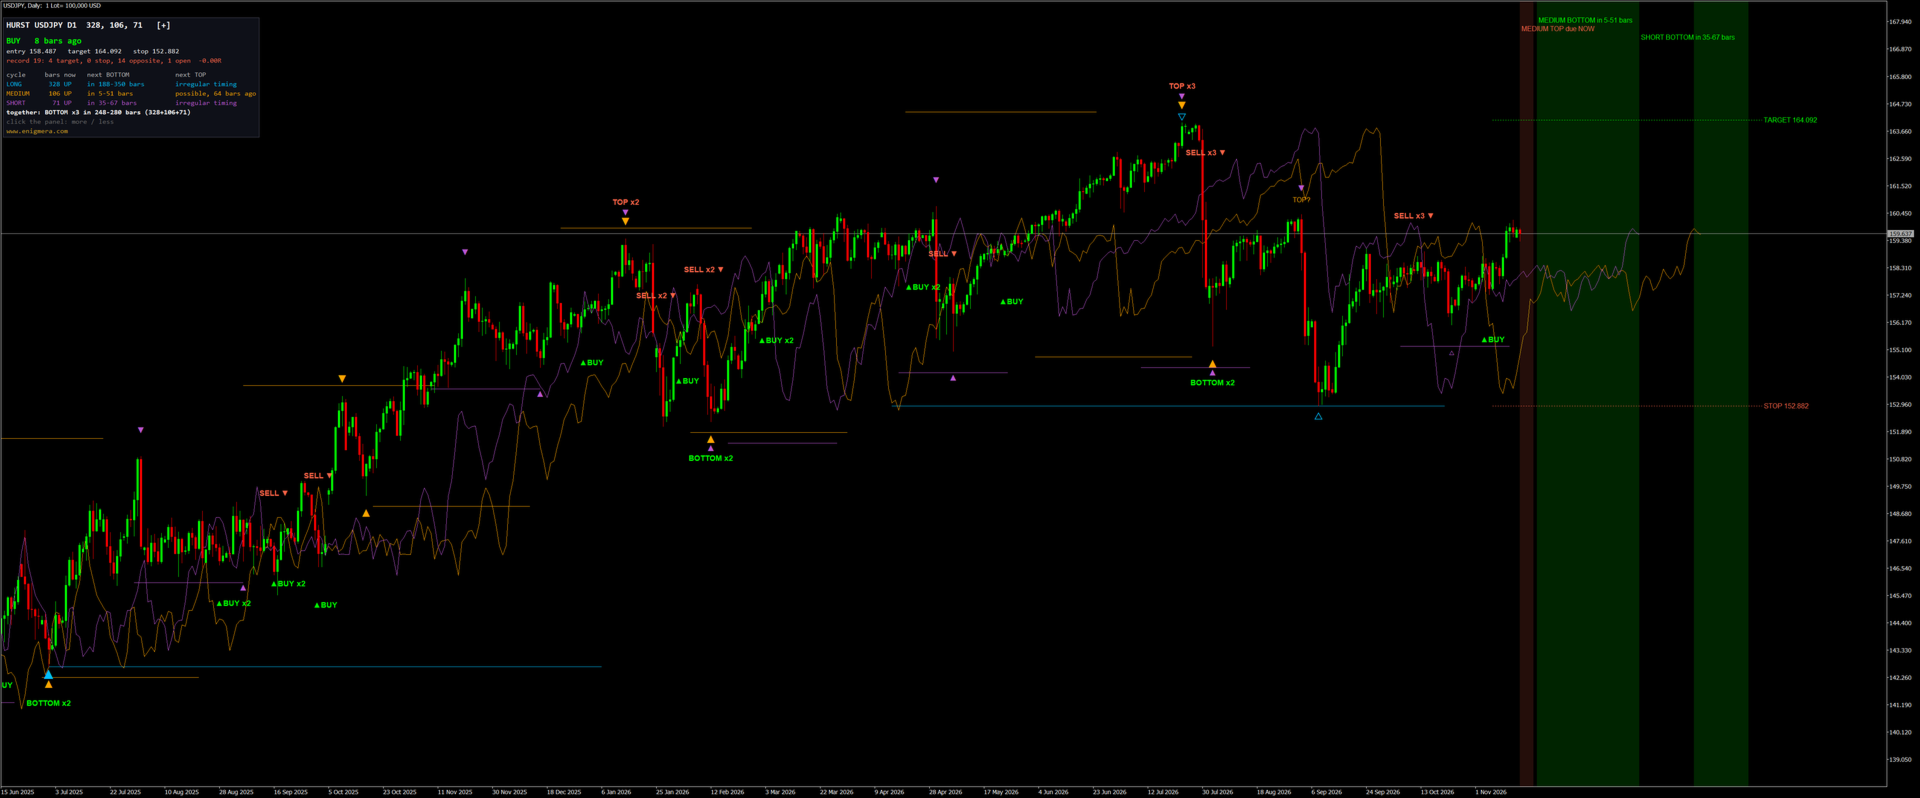
  • BOTTOM x2, TOP x3 and so on where two or more cycles turned together. Hurst considered these the strongest turns.
  • A hollow mark when the turn is younger than three quarters of its cycle. Such a turn can still move.
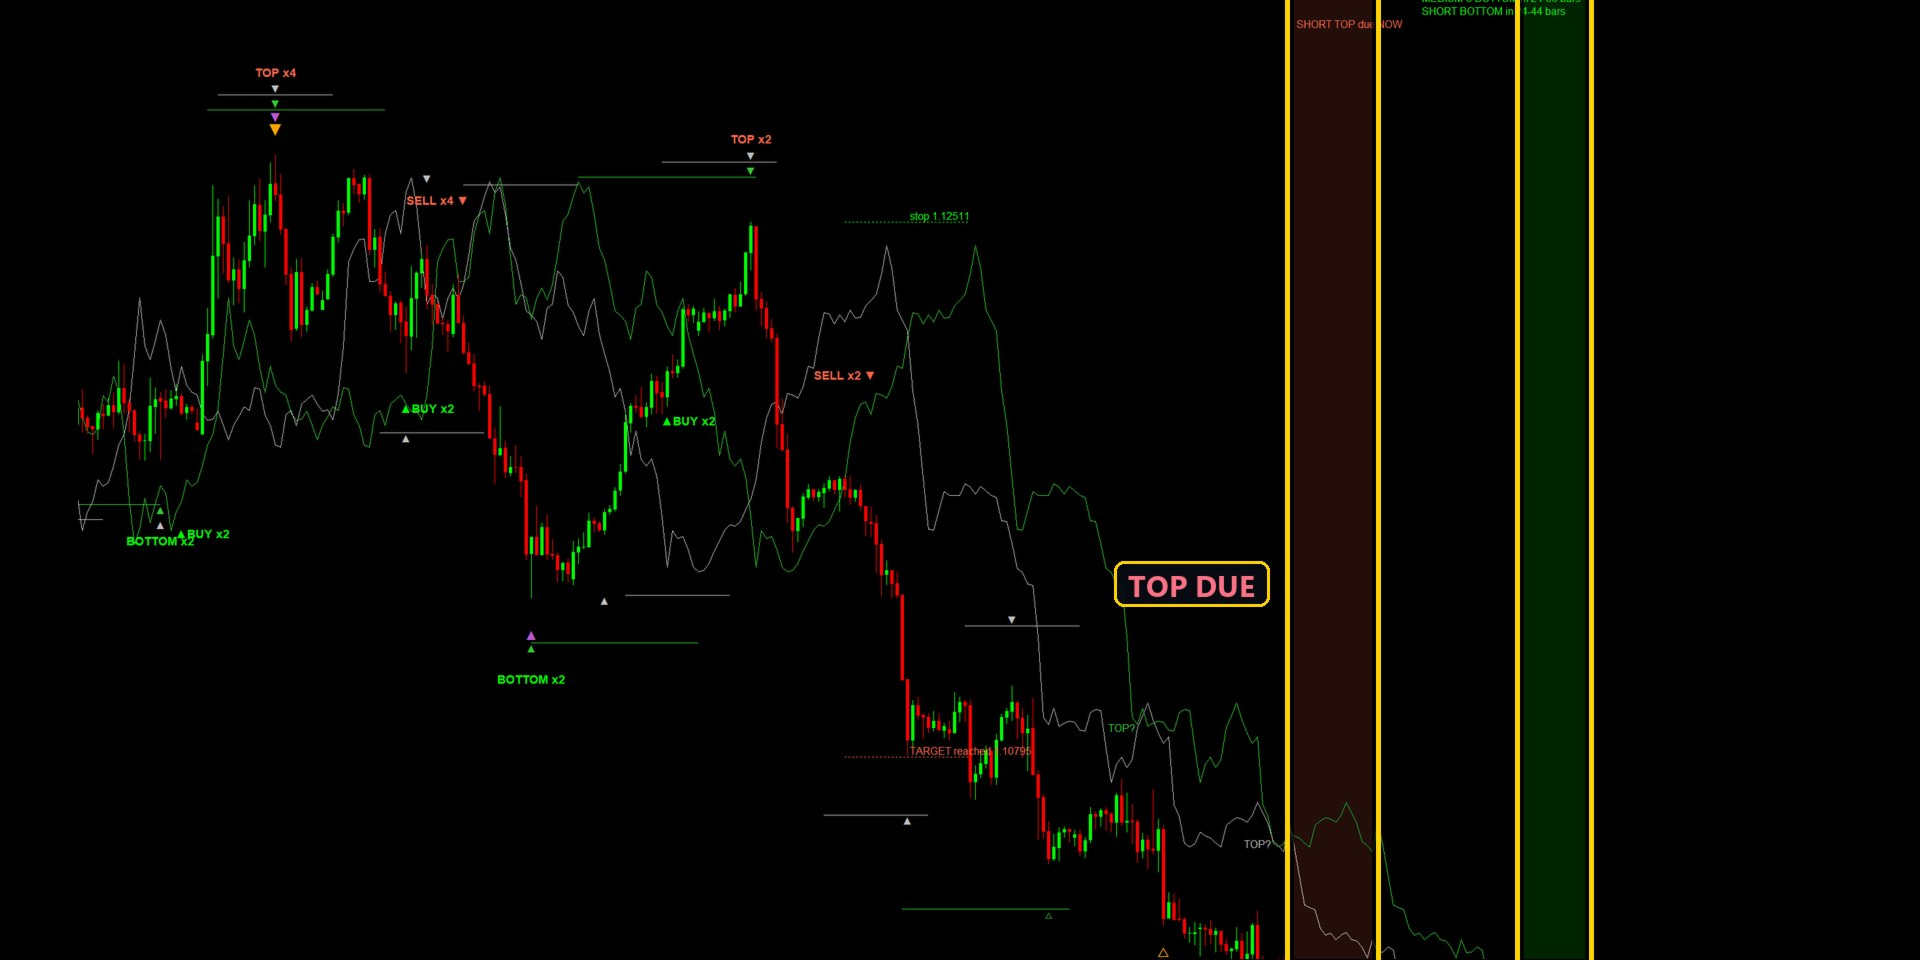
  • The window in which the next bottom and the next top of each cycle are due.
  • A darker band where the windows of several cycles overlap in the future, with a label such as "BOTTOM x4 in 10-16 bars (80+40+20+10)".
  • The FLD lines (Future Lines of Demarcation) of the two cycles the signals use, or of every cycle if you choose so. The valid trend line (VTL) can be switched on.

The signals

A BUY appears when price crosses above the FLD of the shortest cycle while price is above the FLD of the next longer cycle. A SELL is the same rule in the other direction. The target of the last signal is Hurst's FLD projection, and the stop is the last bottom or top of the shortest cycle.

The signals are worked out from closed bars only. A signal in the past stands where it stood when it appeared. The periods themselves are measured on the whole window, so the marks of bottoms and tops can shift when the measured cycles change at the start of a new day.

The panel

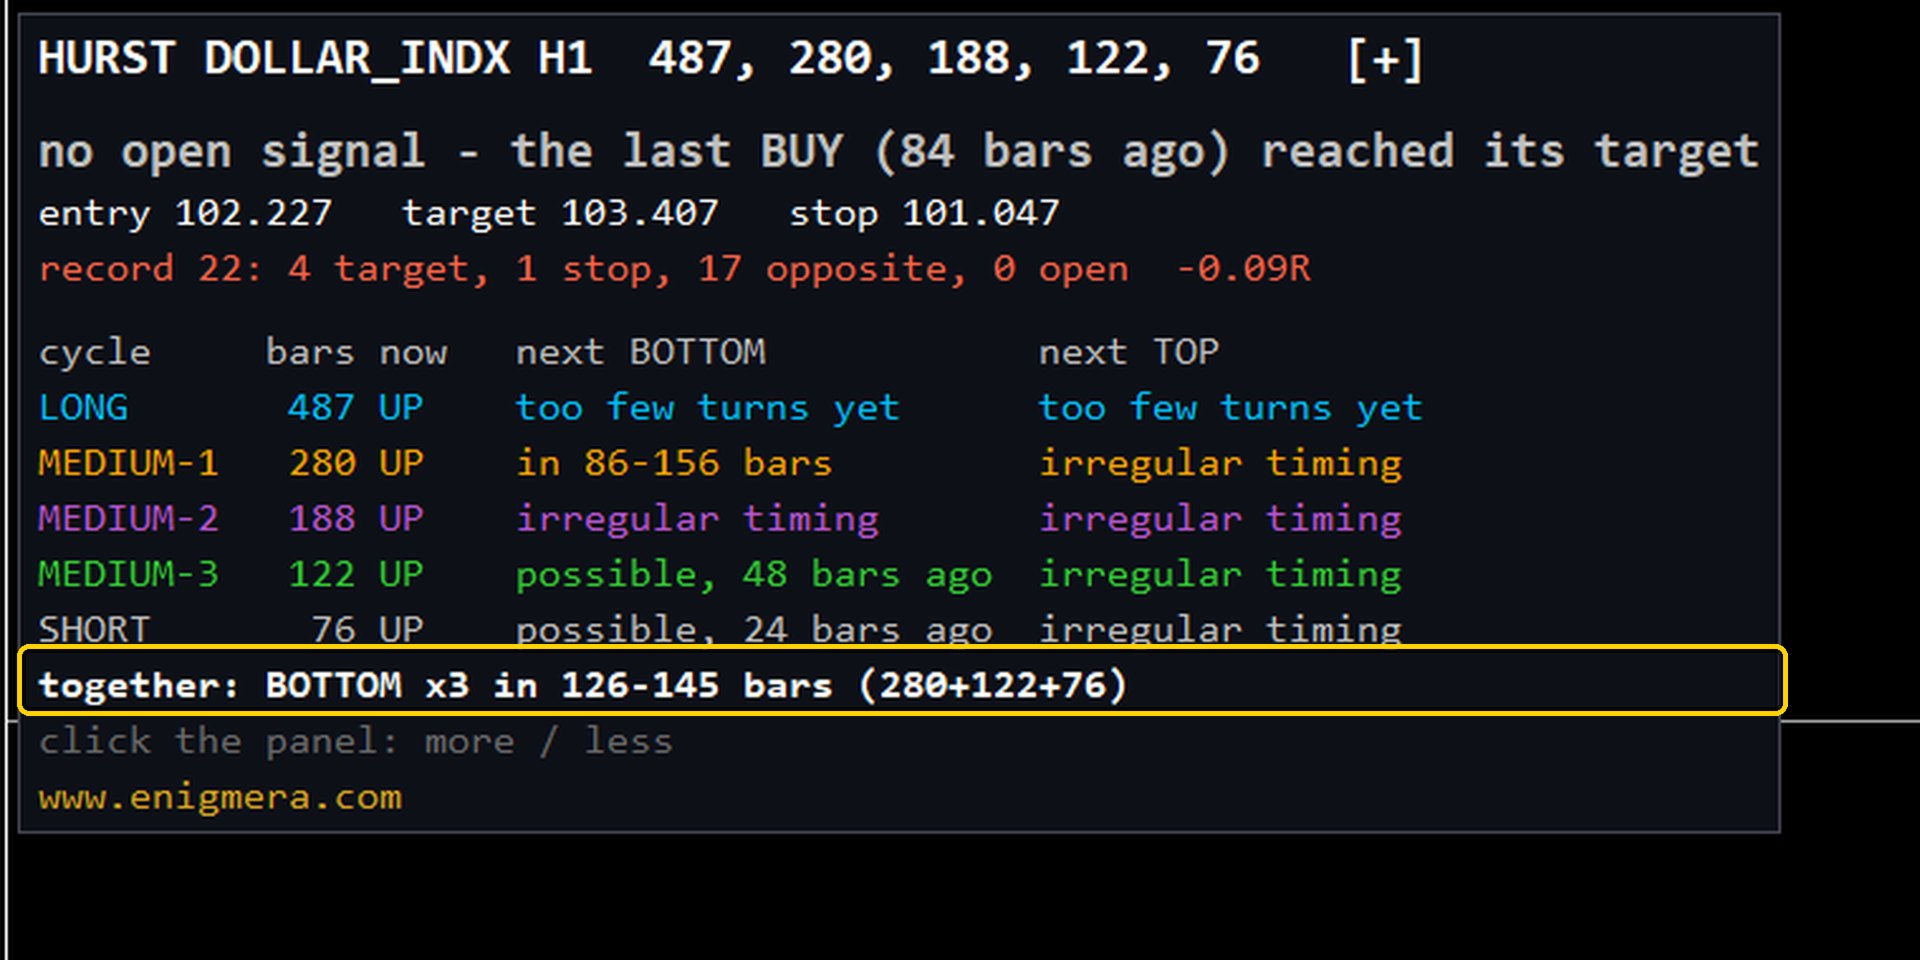
The panel describes in words what the cycles show now and why, then one line per cycle: its length in bars, whether it is rising or falling now, and when its next bottom and top are due. The full size also shows how strong and how steady each cycle is. A click on the panel switches between three sizes.

Alerts

An alert can be sent for every new BUY or SELL, or only for a BUY that follows a BOTTOM of several cycles and a SELL that follows a TOP of several cycles. The number of cycles is set in the inputs. Alerts can also be sent to the MetaTrader app on your phone, and when the window of a new bottom opens.

Inputs

  • What to look at: the number of bars to measure, the price used, the shortest and the longest cycle to look for, how many cycles to keep, and whether the cycles are kept for the day.
  • The nest and how strict: whether only cycles of about half the longer one are kept and how far from the half they may be, the least share of the movement a cycle must explain, how far its period may move between the two halves, and the least number of repetitions.
  • Signals and drawing: which parts are shown, how far back the signals go, the colours of the six cycles, of BUY and of SELL, and the panel size and position.

Notes

The indicator works on any symbol and timeframe. A longer window gives steadier cycles. On a chart with little history, fewer cycles pass the checks, and the panel says so.

Cycles describe timing, not certainty. A due bottom or top is a window in which a turn is likely by the cycle's own rhythm; price can and does turn earlier or later. Use the signals together with your own analysis and risk management.
More from author
Meravith EA
Ivan Stefanov
MERAVITH EA is a multi-timeframe Expert Advisor for MetaTrader 5. It reads MERAVITH on all 21 timeframes of the market it is attached to, from M1 to the monthly, and trades only when the structure across them lines up. Run on all 28 major and cross Forex pairs on one account, it made +470% in a one-year Strategy Tester test. Strategy Tester, one year All 28 Forex pairs on one account, Fusion Markets data, 15.10.2025 - 15.10.2026, M5 +470% - $10,000 to $56,987 on one account, 186 trades, profit f
Imbalance Pro
Ivan Stefanov
5 (4)
Imbalance Pro is a volume imbalance indicator for MetaTrader 4 that measures the buying and selling volume of bulls and bears over the period you choose and draws a coloured line between the two points on your chart: green when the bulls have more volume, red when the bears do, with the percentage difference. Its window shows how the volume developed in time, and an adjustable alert is included. Use it to confirm trends, breakouts and support and resistance, and to spot reversals, on Forex, gol
ATR River
Ivan Stefanov
ATR River is an MT5 trend indicator that draws smooth ATR bands (an ATR channel, similar to a Keltner channel) as a living river on the chart, with a glowing ATR trailing stop line and buy and sell signals confirmed on bar close. For forex, gold (XAUUSD), indices and crypto, on any timeframe. What it shows The river: green in an uptrend, red in a downtrend. The glowing line: your trailing stop level. LONG and SHORT signals: shown after the bar closes, they do not repaint. Flow streaks: the speed
KAMA Confluence Engine KAMA Confluence Engine is a multi-timeframe trend indicator for MetaTrader 5 built on Kaufman's Adaptive Moving Average (KAMA) and tick volume. It shows the trend as a coloured ribbon, gives buy and sell signals checked on four timeframes, and draws a complete trade plan on the chart: entry, Stop Loss and three Take Profit levels, with a scanner of the pairs to trade and alerts. Works on Forex, gold (XAUUSD), indices and crypto. A moving average reacts to a real move and t
MACD divergency
Ivan Stefanov
4.73 (11)
MACD Divergency is a free MACD divergence indicator for MetaTrader 5 that finds bullish and bearish divergences between price and MACD, marks them with arrows and lines on the chart and in the MACD window, and alerts you by popup, sound, email or push notification. Works on Forex, gold (XAUUSD), indices and crypto, on every timeframe. The divergences do not repaint: once confirmed, the arrow stays. Bonus: when you get one of my indicators, you also receive a free one-week version of any of my ot
FREE
Ichimoku Nexus Pro
Ivan Stefanov
5 (2)
Ichimoku Nexus Pro Ichimoku Nexus Pro is a free Ichimoku Kinko Hyo indicator for MetaTrader 5 that draws all three of Goichi Hosoda's theories on one chart: the five lines and the Kumo cloud, the wave theory, the price targets (N, V, E and NT) and the time cycles. It adds a multi-timeframe cloud that does not repaint, cross signals filtered in flat markets, and a scanner that ranks every pair in Market Watch. Works on Forex, gold (XAUUSD), indices and crypto. Ichimoku Kinko Hyo with all three of
FREE
Currency Strength Anchor is a currency strength meter for MetaTrader 5 that shows which currency, metal or index is strongest and which is weakest, anchored to the daily, weekly and monthly open, with two scanners that list the best pairs to trade. Works on Forex pairs, gold (XAUUSD), silver and indices. Session-adaptive and non-repainting: the values come from completed price data. Most strength meters compare instruments over a fixed lookback period. The result changes meaning as the trading d
Order Block Scorecard is a free order block and supply and demand indicator for MetaTrader 5 that marks the zones on your chart and keeps a score for every one: how many times price tested it, how often it held, and how far price travelled afterwards. Works on Forex, gold (XAUUSD), indices and crypto, on any timeframe, with an alert when price enters a zone that has never been tested. The three numbers describe what already happened on the symbol and timeframe in front of you. They are a record
FREE
Meravith Scanner
Ivan Stefanov
5 (3)
Meravith is a structural market analysis framework designed to organise multi-timeframe information into a continuously updated contextual model. Meravith blog:  https://www.mql5.com/en/blogs/post/770467 Contextual Market Intelligence Meravith transforms thousands of structural calculations into a coherent representation of the current market. For every analysed timeframe, the system evaluates: Trend Direction Structural Reliability Volume Participation Dynamic Equilibrium Dynamic Support Tr

Fibowave
Ivan Stefanov
FIBOWAVE FIBOWAVE is an automatic Elliott wave indicator for MetaTrader 5 that counts the waves on seven timeframes at once, from the monthly chart down to M5, and draws the Fibonacci retracement of the running correction, the Fibonacci targets of waves 3, 5 and C, the price level where the count fails, and an alert when a wave 3 or 5 starts. Works on Forex, gold (XAUUSD), indices and crypto, with nothing to set up. Counting Elliott waves by hand is slow, and two analysts rarely arrive at the sa
Primes Action is a support and resistance indicator for MetaTrader 5 that draws the high and low levels of the previous day, week and month and shows the breakout when price breaks them, with arrows, a dashboard and alerts. Each timeframe has its own colour, so the three references are easy to tell apart. Works on Forex, gold (XAUUSD), indices and crypto; the levels come from one-minute data and are the same on every timeframe. How the levels are found The exact high or low of a period is oft
GANN Master is a Gann support and resistance indicator for MetaTrader 5 that draws W. D. Gann's square-root levels for the day, the week and the month, marks the zones where the targets of buyers and sellers meet, and shows every breakout with its targets. Works on Forex, gold (XAUUSD), indices and crypto. The levels stay fixed for the whole period and do not repaint. How the levels are built The high of the previous period becomes the TOP line and its low becomes the BOTTOM line. From TOP the
Meravith
Ivan Stefanov
5 (3)
Market makers' tool. Meravith will: Analyze all timeframes and display the current trend in force. Highlight liquidity zones (volume equilibrium) where bullish and bearish volumes are equal. Display all liquidity levels across different timeframes directly on your chart. Generate and present text-based market analysis for your reference. Calculate targets, support levels, and stop-loss points based on the current trend. Compute the risk/reward ratio for your trades. Determine position size accor
Meravith MT5
Ivan Stefanov
5 (3)
MERAVITH is a multi-timeframe volume and liquidity indicator for MetaTrader 5 that shows the trend, support and resistance zones, entry, targets and stop loss on every timeframe, on Forex, gold (XAUUSD), indices and crypto. It gives you a complete liquidity map of the market, a hedge-fund-style liquidity tool, and it does every calculation automatically with a proprietary volume-weighted average price method, so there is no subjective interpretation. Bonus after purchase: a set of video lessons
RSI Divergence Pulse is an RSI-based indicator for MetaTrader 4. It detects regular and hidden divergences, draws them on the price chart and in the RSI subwindow, shows RSI values from five timeframes in one panel, and reports the current RSI state in an information panel. Alerts can be sent when a divergence is confirmed. How it works The indicator calculates a standard RSI and a signal line, which is a simple moving average of the RSI. Significant RSI highs and lows are located with a frac
Enigmera
Ivan Stefanov
5 (9)
ENIGMERA: The core of the market ENIGMERA is a support and resistance indicator for MetaTrader 4 that uses fractal cycles to calculate the support and resistance levels, shows the accumulation phase, and gives the trend direction, the targets and the stop-loss levels, in a trend or in a correction. Works on Forex, gold (XAUUSD), stocks, indices and crypto, on every timeframe, with no redrawing. ENIGMERA: the core of the market. (This is a manual indicator and contains features that may not supp
Sense
Ivan Stefanov
5 (2)
SENSE is an automated fusion of  GANN target levels combined with fractal trend support lines. Mighty powerful combination. The system tells us where to open and close our trades. No redrawing.  No more wasting time on complex calculations— SENSE does it all for you. Just insert the indicator. Key Principles: Market is bullish when price is above the white lines - Buy above the white lines, stop below - Green lines are bullish targets Market is bearish when price is below the white lines - S
Two Snakes
Ivan Stefanov
5 (1)
2 SNAKES  is a first class scalping system. As the entries are quite precise, you are likely to become addicted to this system very quickly.  You have 2 snakes. When you see a candle above or below them that does not touch them - that is your scalping signal. Then buy or sell at the green line or close. If you use a larger time frame, scalping can become trend following. The snakes are calculated precisely in relation to the current state of the market. They ARE NOT moving averages.  You decide
GANN Master
Ivan Stefanov
5 (1)
GANN Master draws W. D. Gann's square-root levels for the current day, week or month and marks the zones where the targets of buyers and sellers meet. The levels are calculated from the high and low of the previous period, they stay fixed for the whole period and they do not repaint. How the levels are built The high of the previous period becomes the TOP line and its low becomes the BOTTOM line. From TOP the indicator measures three bearish targets downwards (Bears' interest 1, 2 and 3), and fr
Fifty Pro
Ivan Stefanov
5 (1)
One of the very few indicators that calculate levels solely based on price. The indicator is not affected by time frames, trends, or market cycles. One of the most logical indicators ever made. The indicator automatically calculates the daily levels of interest for market participants based on the activity from the previous day. It also calculates weekly, monthly, and yearly levels based on the activity from the previous week, month, or year. Combining everything this way, every day you know exa
Currency Strength Anchor is a currency strength meter for MetaTrader 4 that shows which currency, metal or index is strongest and which is weakest, anchored to the daily, weekly and monthly open, with two scanners that list the best pairs to trade. Works on Forex pairs, gold (XAUUSD), silver and indices. Session-adaptive and non-repainting: the values come from completed price data. Most strength meters compare instruments over a fixed lookback period. The result changes meaning as the trading d
Transaction Speed is a volume and order flow indicator for MetaTrader 5 that shows where large orders accumulate: it highlights the zone where interest is declared, draws the orders accumulation zone, and marks the breakout and the new trend when a candle closes outside it, with a high-volatility alert. Works on every timeframe, on high-volume instruments such as EURUSD, USDJPY, GBPUSD and gold. It works like an order book on a big scale. This is the indicator for the biggest money. It's perfor
Fifty Pro is a support and resistance indicator for MetaTrader 5 that calculates the daily, weekly, monthly and yearly levels of interest by halving the previous period's range, from its high and low, using price alone. Every day you see where the market is and what to expect next, on any timeframe, on Forex, gold (XAUUSD), indices and crypto. Buttons switch each period's levels on and off. One of the very few indicators that calculate levels solely based on price. The indicator is not affect
SPECULATOR is a manual trading system and indicator that helps you identify key support zones and market direction. Master the market with a simple strategy and hidden wisdom! This is a manual indicator and contains features that may not supported by the MetaTrader current testing environment . You choose any top and bottom on the chart, and the indicator draws: A support zone for your trend. For a bullish trend, a green zone appears; for a bearish trend, a red one. The support zone's sensitivit
Naturu
Ivan Stefanov
5 (1)
Gann support and resistance zones from any swing you choose. Mark a high and a low on the chart, and Naturu calculates the levels of sellers and buyers by W. D. Gann's method of dividing price: halves, quarters, eighths and finer. Where a sellers' level and a buyers' level come close together, Naturu draws a zone. The closer the two levels, the stronger the interest of both sides - these zones are support, resistance and ready targets. How to use it Load Naturu. Two lines appear: TOP and BOTTOM.
RSI Divergence Pulse is an RSI divergence indicator for MetaTrader 5 that finds regular and hidden bullish and bearish divergences, places buy and sell arrows on the chart, and shows a multi-timeframe RSI panel (M5 to D1) with the overbought and oversold zones, with alerts by popup, sound, email or push notification. Works on Forex, gold (XAUUSD), indices and crypto, on any timeframe. Divergence lines are drawn on both the price chart and the RSI window. Features Color-Coded RSI Line The RSI
Chart AI Assistant – AI analysis of your live chart, in one click Chart AI Assistant is an AI chart analysis tool for MetaTrader 5 that reads your live chart in one click and tells you the trend, market structure (BOS / CHOCH), order blocks, fair value gaps, liquidity, chart and candle patterns, the buy and sell zones and the likely next move, in 18 languages. Works on Forex, gold (XAUUSD), indices and crypto, on any timeframe. The AI looks at the picture of your chart the same way you do: the c
Gann Gold Scalp  is a gold scalping indicator for MetaTrader 5 that shows where to open, where to take profit and where the stop loss is, on the Gann levels of the day, the week and the month. Clear BUY and SELL signals, two entries, TARGET 1 and TARGET 2, the STOP, chart alerts and push notifications. No repaint. Made for XAUUSD on M5, and it works the same way on forex, indices, stocks and crypto such as Bitcoin, on every timeframe. After your purchase, please send me a message here on mql5.
Filter:
No reviews
Reply to review