
JET Weis Waves PRO is a paid indicator for MetaTrader 5 that draws the price waves on the price chart and shows, for each wave, how much volume it needed, how long it took, how far it went and its delta (buying minus selling volume), compared with the previous waves in the same direction. It adds a panel with the current wave, highlights, alerts and data for Experts. It is an indicator only: it never opens, closes or changes orders.
What it shows
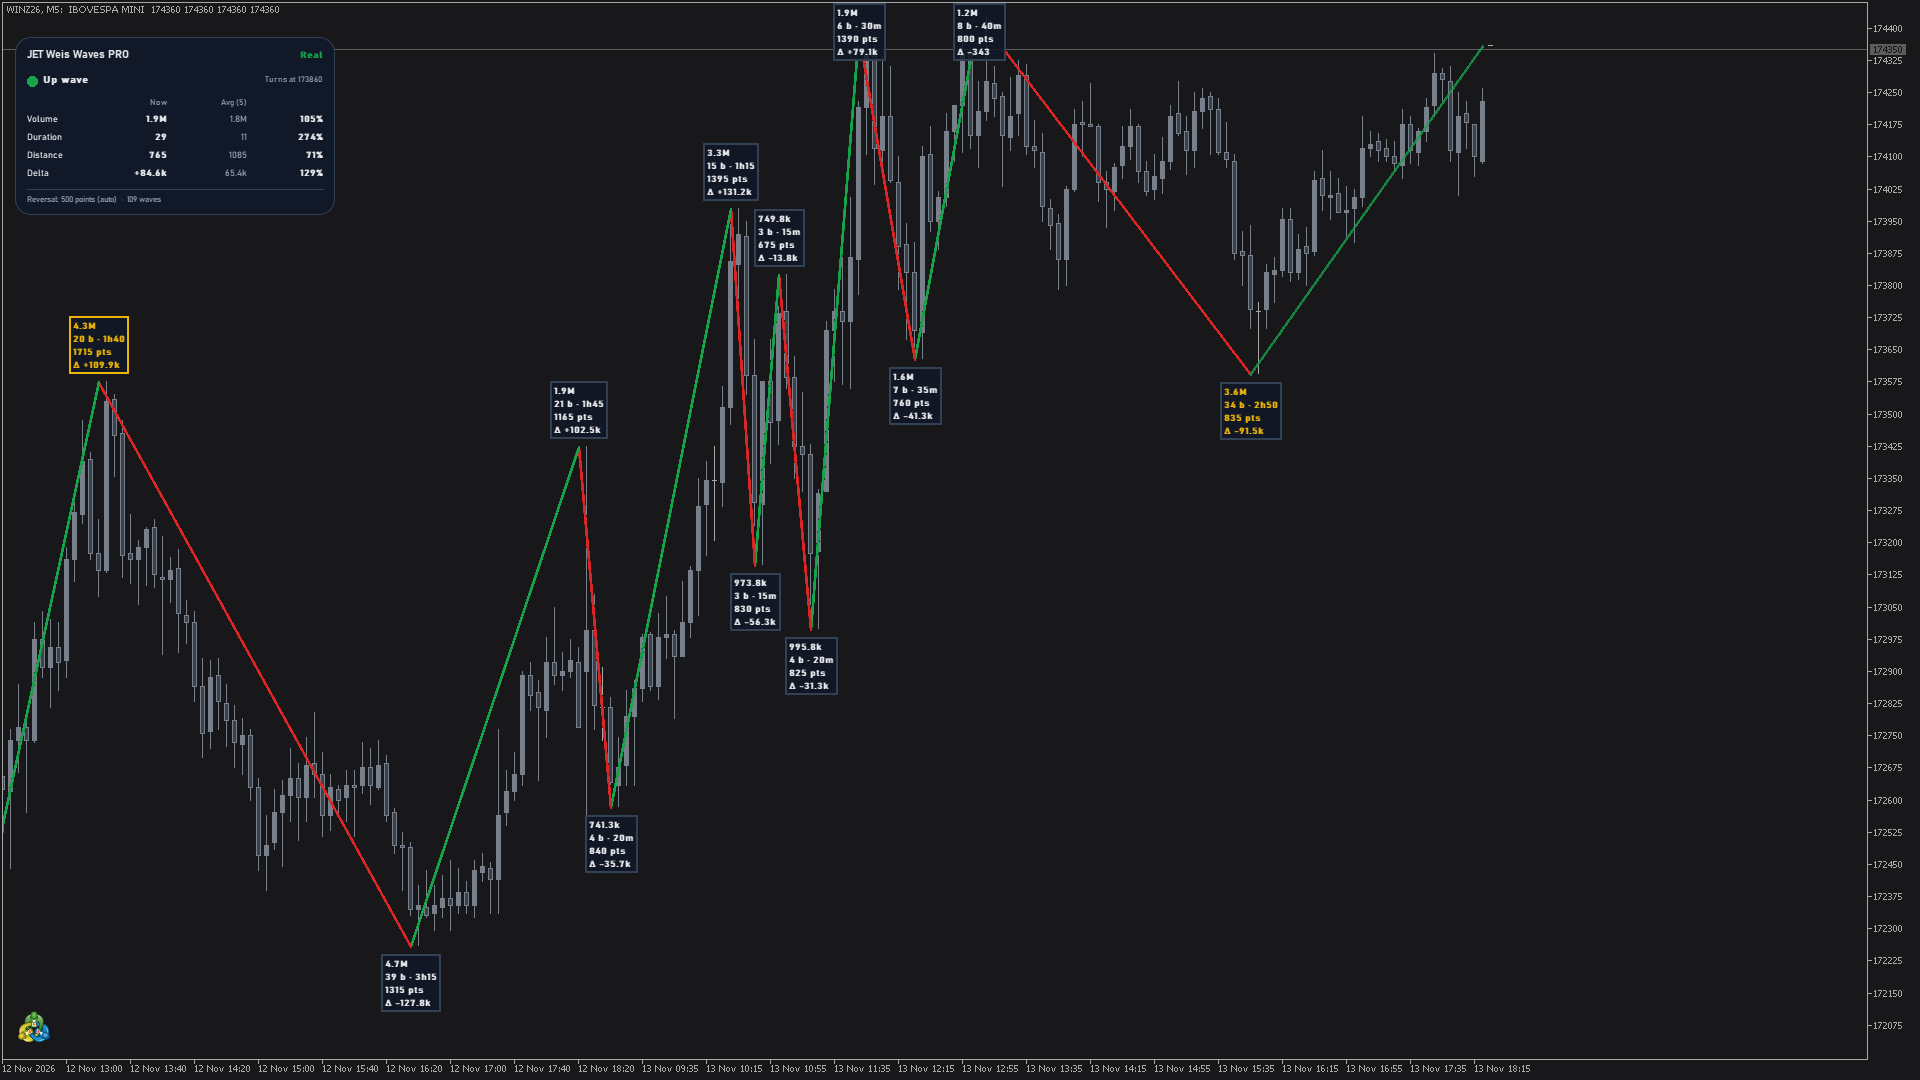
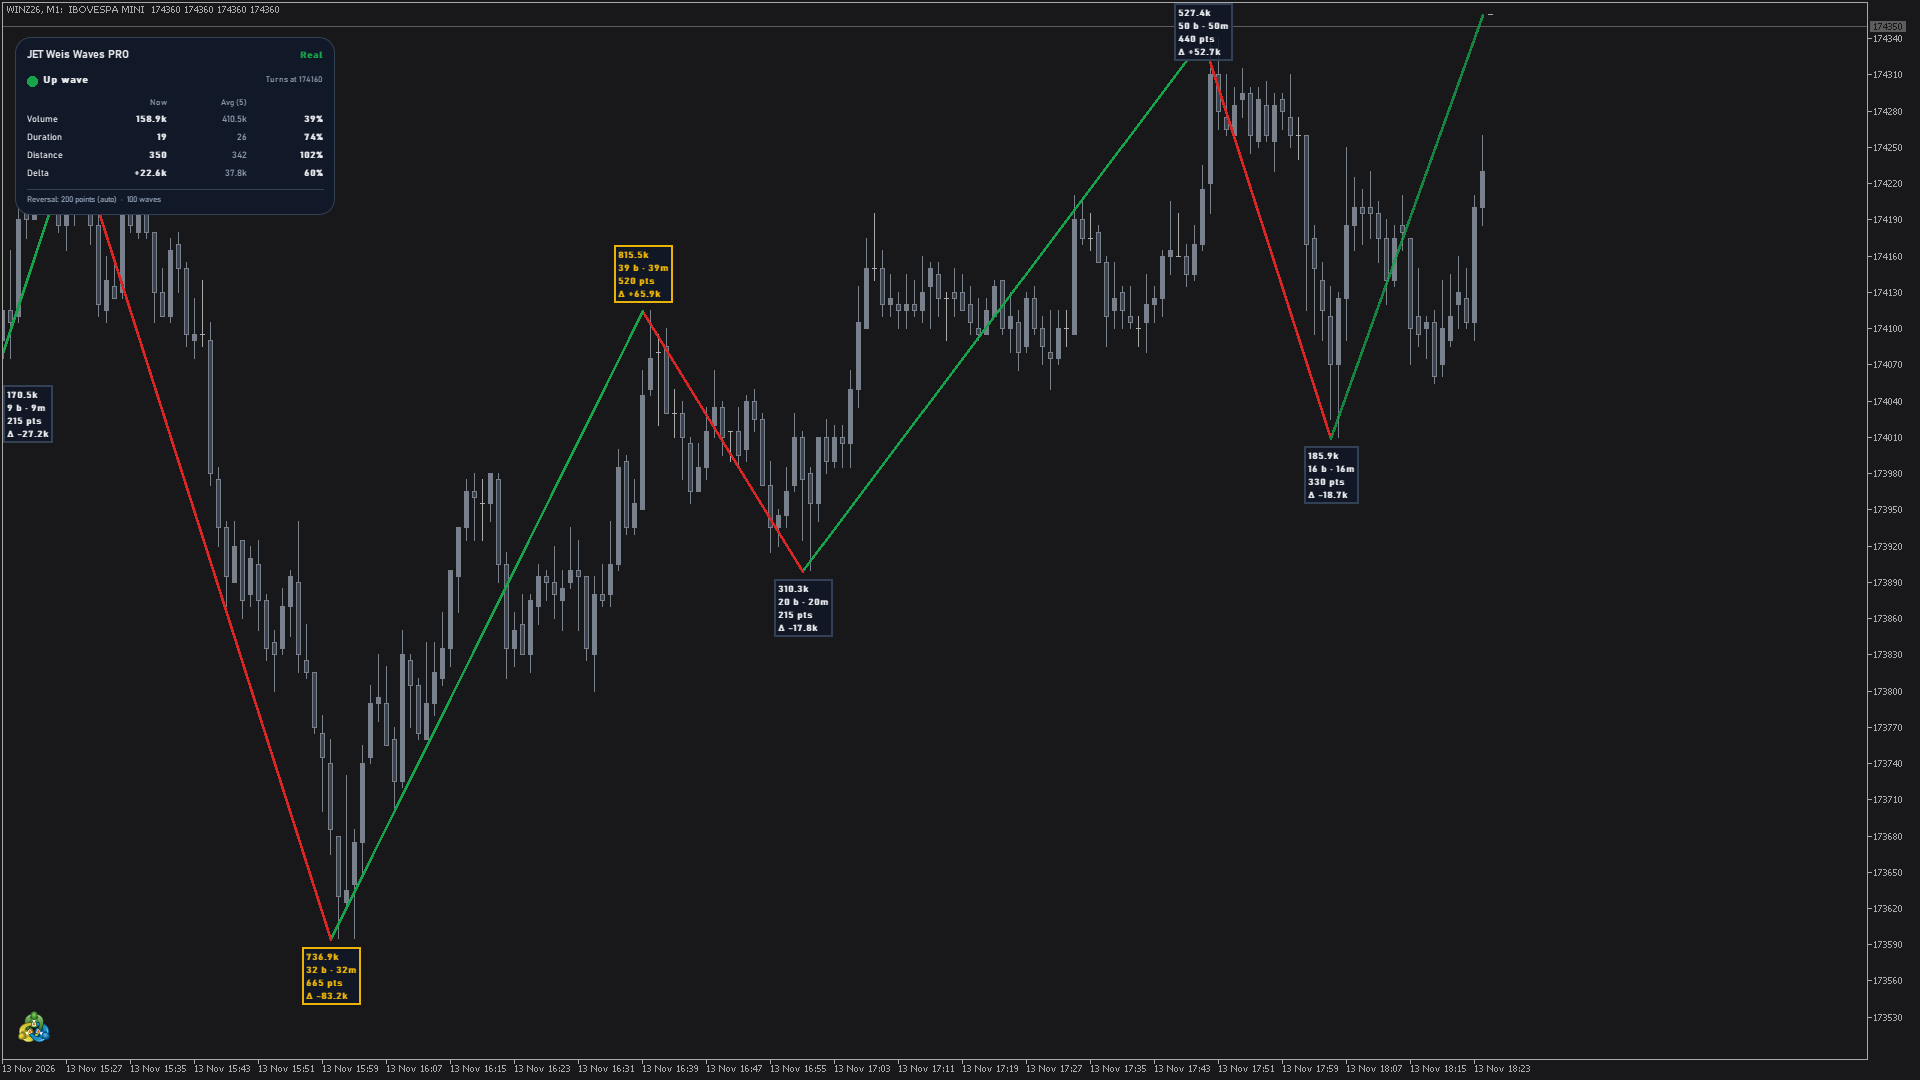
- Wave lines: each wave is a line from one turning point (high or low) to the next, green for up waves and red for down waves. The wave turns when price moves back by the reversal you set.
- Wave in progress: drawn dashed from its start to the current extreme until the turn is confirmed. Confirmed waves never change.
- Label at the end of each wave, with up to four lines: volume in short form (e.g. 12.4k or 1.2M); duration in bars and in time (e.g. "18 b · 1h30"); distance in points or ticks (e.g. "350 pts"); delta (e.g. "Δ +1.2k"), or "Δ –" when there are no ticks for that wave. Labels of up waves sit above the end of the line, labels of down waves below it.
- Highlights, compared with the last 5 waves in the same direction (input Waves compared): biggest recent wave = label with a gold border; abnormal volume = label text in gold (dark amber on the light theme); effort without result = label with an orange border. A wave needs at least two previous waves in the same direction to be compared.
- When two labels would overlap, the newest wave keeps its label and the older one is hidden; zoom in to see it.
Real or estimated data
- Real: where the broker sends the trades with the aggressor side (futures and stocks of any exchange, e.g. B3, CME and others), the volume is the real traded volume and the delta is real.
- Estimated: forex, CFDs and metals have no trade data on MetaTrader 5: the volume is the tick volume and the delta is estimated. The panel then shows Estimated in amber.
- The mode is always visible at the top right of the panel and is also available to Experts (buffer 8).
- The delta needs the tick history: by default it covers the last 10 days. While the ticks load, the panel shows "Loading ticks for the delta...".

How to add it to the chart
- Open the Navigator (Ctrl+N) and find JET Weis Waves PRO under Indicators > Market.
- Drag it to the price chart (or double-click it), adjust the Inputs tab if you wish and click OK.
- It works on any symbol and any timeframe up to D1. On W1 and MN1 the panel shows "Works up to the D1 chart".
- To remove it, open the indicator list (Ctrl+I), select it and click Delete.
The panel
- Header: product name and data mode (Real in green, Estimated in amber).
- Current wave: a colored dot with "Up wave" or "Down wave", and "Turns at" with the price that would confirm the turn.
- Table: columns Now, Avg (5) and %, for Volume, Duration (bars), Distance and Delta. Now is the current wave so far; Avg is the average of the previous waves in the same direction; % is Now as a percentage of Avg. The Delta row appears only when the delta is on.
- Footer: reversal in use (e.g. "Reversal: 100 points (auto)") and number of waves on the chart.
- Drag the panel by its header to put it anywhere on the chart. Before the first wave it shows "Waiting for the first wave".
Inputs
Waves
- Reversal mode = Points. Options: Points, Percent of price, Volatility (ATR multiple). Chooses how the reversal that turns a wave is measured.
- Reversal in points (0 = automatic for the symbol) = 0. With 0, the indicator picks a round value suited to the symbol and timeframe, shown in the panel footer with "(auto)". Type a value to fix it. Larger values give fewer and longer waves.
- Reversal in % of price = 0.3. Used with Percent of price.
- Reversal in ATR multiples = 2.0 and ATR period = 14. Used with Volatility (ATR multiple): the reversal follows the volatility of the chart.
- Price used = High / Low. With Close, the waves join closing prices and ignore the wicks.
- Bars of history (100-5000) = 1000. Number of bars on which the waves are drawn.
- Volume = Automatic (real when the broker sends it). Other options: Real volume, Tick volume.
Comparison with previous waves
- Waves compared (same direction) = 5. How many previous waves in the same direction make the averages of the panel and the highlights.
- Abnormal volume from (x the average) = 1.8.
- Effort without result: volume from (x the average) = 1.5 and Effort without result: distance up to (x the average) = 0.6. A wave with at least this volume and at most this distance, compared with the averages, is marked as effort without result.
Labels
- Show volume, Show duration, Show distance, Show delta = true. Turn off the lines you do not need; with all four off, only the wave lines are drawn. Turning off Show delta also stops the loading of ticks and hides the Delta row of the panel.
- Distance unit = Points. Other option: Ticks (the minimum price change of the symbol). Also used in the panel and in buffer 4.
- Font size = 9.
Delta
- Data = Automatic (real side when the broker sends it). With Always estimated, the delta is estimated even where real data exist.
- Days of ticks for the delta (0 = off) = 10. More days cover more waves but take longer to load. Waves older than the loaded ticks show "Δ –".
Panel
- Show the panel = true.
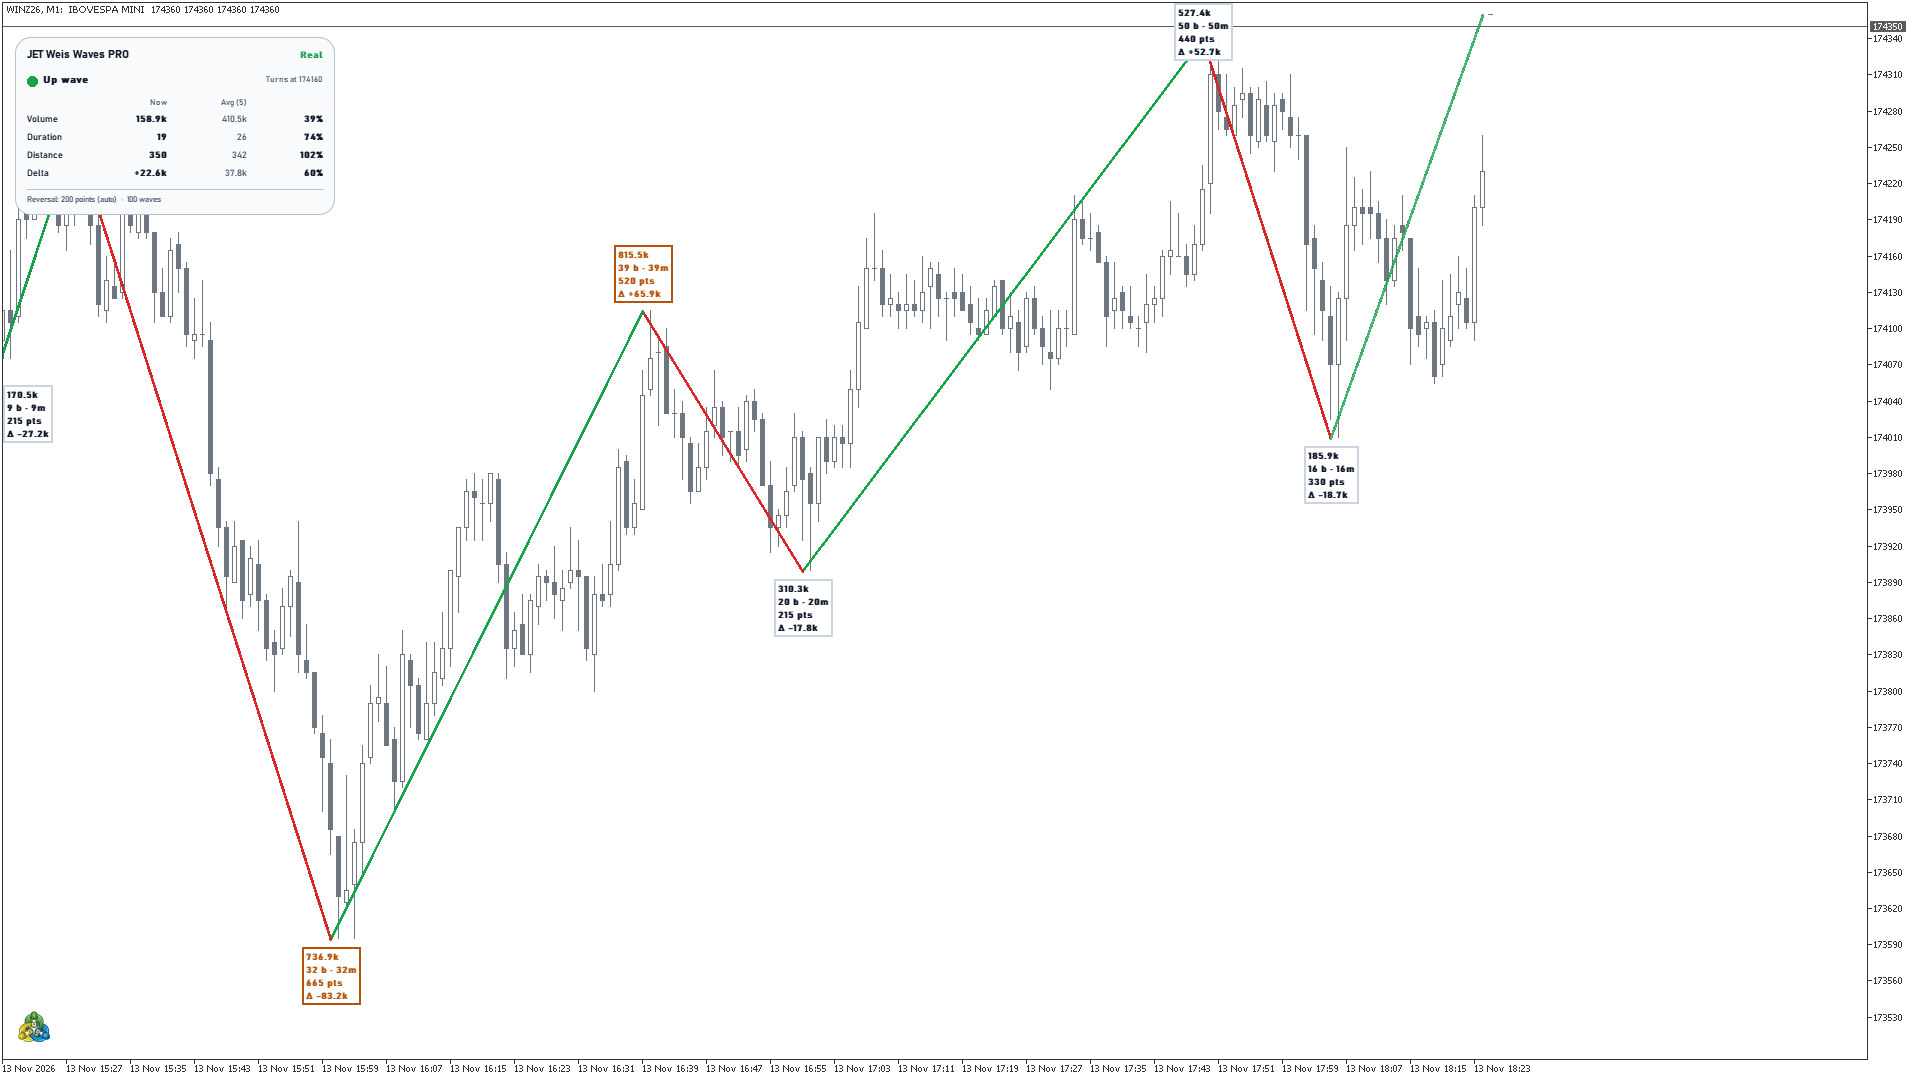
- Theme = Automatic (chart background). Other options: Dark, Light. It also applies to the wave labels.
- Panel size (%) = 100 (50 to 300), useful on high-resolution screens.
- Language = Terminal language, or one of the 11 languages.
Colors
- Up waves = green; Down waves = red; Biggest recent wave = gold; Effort without result = orange.
Alerts
Alerts fire once, when a new turn confirms a wave (never for the history). Group Alerts (on the confirmed wave):
- New wave (turn confirmed) = Off. Message, e.g.: "Down wave started (top confirmed)".
- Abnormal volume wave = Popup + Sound. Message, e.g.: "Abnormal volume wave: 2.1 x the average".
- Effort without result = Off. Message, e.g.: "Effort without result: volume 1.7 x, distance 0.4 x".
- Modes: Off, Popup, Sound, Smartphone notification, Popup + Sound, Notification + Sound, Popup + Notification, Popup + Sound + Notification.
- Sound = alert (a sound of the terminal). Also send e-mail = false; when true, each alert that is on also sends an e-mail. An alert set to Off sends nothing.
- Push notifications and e-mail must be set up in Tools > Options (Notifications and Email tabs). Alert messages use the panel language.
Data for Experts (iCustom)
The indicator has 9 buffers with one value per bar, readable with iCustom and CopyBuffer. They are not drawn on the chart.
| Buffer | Content |
|---|---|
| 0 | Direction of the wave that contains the bar: +1 up, -1 down |
| 1 | Volume of the wave so far, up to the bar |
| 2 | Turn confirmed on this bar: +1 top, -1 bottom, 0 none |
| 3 | Volume of the last confirmed wave |
| 4 | Distance of the last confirmed wave, in the Distance unit (points by default) |
| 5 | Duration of the last confirmed wave, in bars |
| 6 | Delta of the last confirmed wave (empty without ticks) |
| 7 | Marks of the last confirmed wave: 1 biggest recent, 2 abnormal volume, 4 effort without result; the values add up (e.g. 3 = biggest and abnormal, 0 = none) |
| 8 | Data mode: 1 real, 2 estimated |
- Confirmed waves never change. Buffers 0 and 1 of the bar in progress (index 0) change while the wave forms; the buffers of closed bars (index 1 or higher) do not change.
- Empty values are EMPTY_VALUE (outside the bars of history and before the first wave).
- Example: handle = iCustom(_Symbol, PERIOD_CURRENT, "Market\\JET Weis Waves PRO"); then read buffer 2 of bar 1 with CopyBuffer to know whether the last closed bar confirmed a turn.
- In the Data Window (Ctrl+D) the values appear as Wave direction, Wave volume so far, Turn confirmed (+1 top, -1 bottom) and so on.
Together with the free Weis Waves RSJ
JET Weis Waves PRO draws only on the price chart. If you also want the classic histogram of wave volume, add the free Weis Waves RSJ to the same chart: it opens in a subwindow below the candles, while the PRO stays on the candles. Each indicator has its own settings, so their turns may not always match.
Tips and frequent questions
- Too many small waves? Increase the reversal or switch to Volatility (ATR multiple). Too few? Decrease it.
- "Waiting for the first wave": price has not yet moved back by the reversal within the loaded bars; lower the reversal or increase Bars of history.
- Delta shows "–": the wave is older than the loaded ticks, or the broker has no tick history for it; increase Days of ticks for the delta.
- A label is missing: it would cover a newer label; zoom in, reduce Font size or turn off some label lines.
- No highlights yet: the comparison needs at least two previous waves in the same direction.
- Reading the waves: compare waves in the same direction, for example a new high reached with less volume than the previous up waves, or a wave with large volume and little distance (effort without result). These readings describe what happened; they do not forecast the next move.
- The automatic reversal depends on the symbol and the timeframe; to compare charts with the same reversal, type the value in points.
- Tested in the Strategy Tester on WIN and EURUSD.
Download
- JET Weis Waves PRO: waves on the price chart, panel, alerts and data for Experts.
- Weis Waves RSJ: free histogram of wave volume in a subwindow.
Questions and suggestions: send me a private message through my MQL5 profile.
Trading involves risk of loss. The indicator shows market information; it does not forecast prices or guarantee results. In estimated mode, the volume is the tick volume and the delta is an estimate.




