FVG OB Liquidity Volume MSS BOS

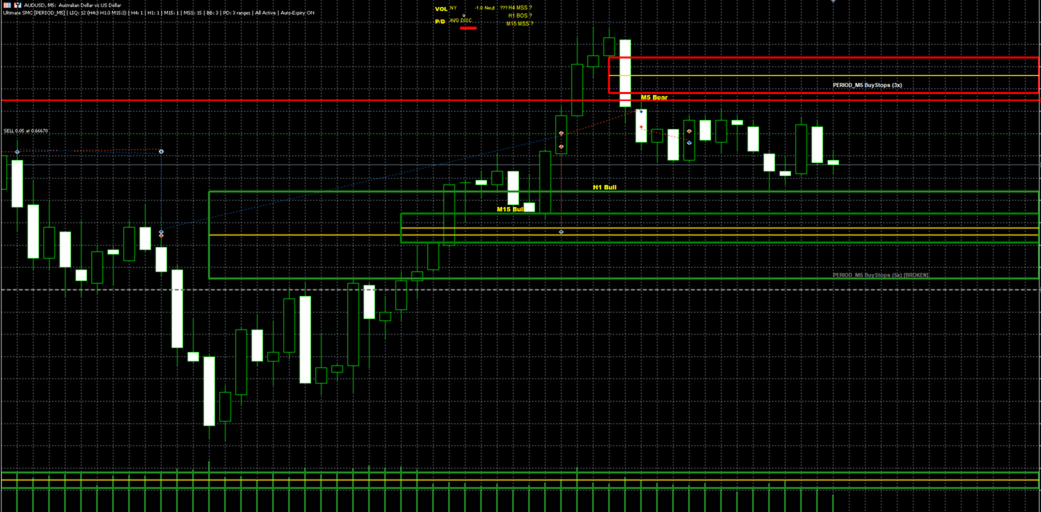
Introducing the Ultimate Smart Money Concepts Suite

Tired of using a dozen different indicators to find a single high-quality trade setup? The Ultimate Smart Money Concepts Suite is the first all-in-one indicator designed to do the heavy lifting for you. It automatically analyzes key institutional footprints in the market, providing a clear, concise, and actionable view of where the "smart money" is moving. This isn't just an indicator; it's your complete toolkit for reading the market like an institution.

What It Does & Why It Helps You

Our indicator operates on the core principle of Smart Money Concepts: the market is moved by large institutional players (the "smart money"). Your job as a retail trader is not to fight them, but to identify their footprints and ride their coattails. This suite acts as a lens to reveal those footprints.

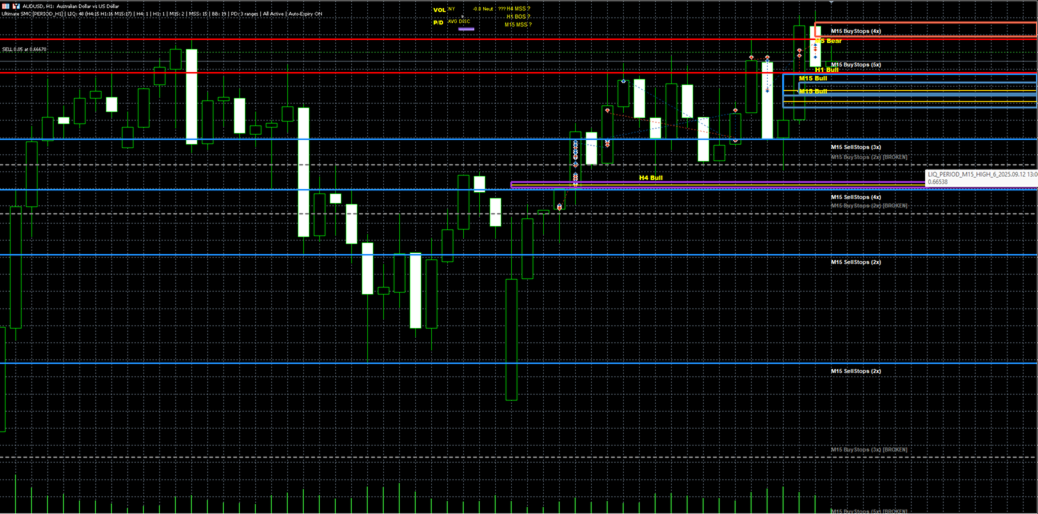
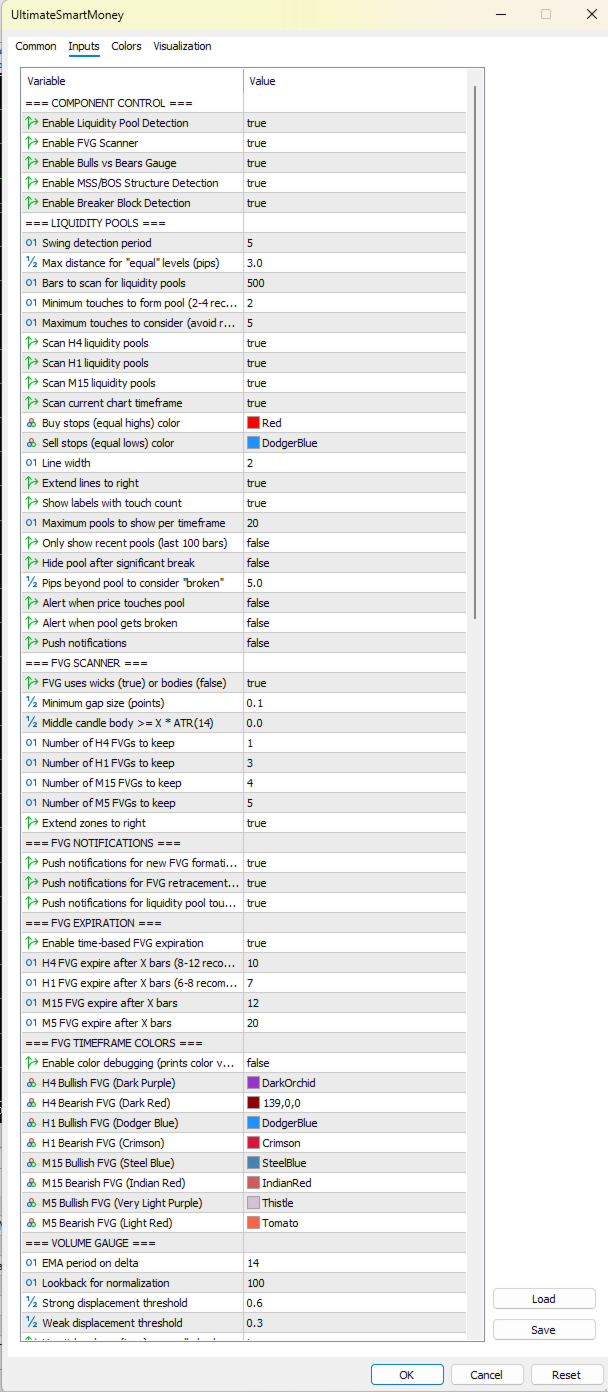
1. Liquidity Pool Detector: The Institutional Playbook

  • What it does: The indicator automatically identifies and plots "liquidity pools" at equal highs and equal lows. These are not just random levels; they are price points where a high concentration of stop-loss orders from retail traders are known to accumulate.

  • How it helps you: Institutional traders require massive liquidity to fill their orders without moving the price against them. They will often "sweep" these liquidity pools—driving price just past them to trigger stop losses and collect orders—before reversing the market. This feature helps you avoid being trapped in these manipulations and, more importantly, identifies the likely targets of institutional moves. You can anticipate when a "fakeout" is likely to occur and enter a trade in the direction of the actual institutional order flow.

2. Fair Value Gap (FVG) Scanner: Finding the Unfilled Orders

  • What it does: An FVG is a key institutional footprint, a price imbalance left behind when price moves too quickly. The indicator scans multiple timeframes simultaneously to find and draw these zones on your chart.

  • How it helps you: An FVG acts as a magnet for price. When the market creates a strong impulse move, it often leaves a gap that needs to be filled to achieve market efficiency. This indicator helps you identify these unfilled orders and gives you the opportunity to enter a trade when price returns to "fill the gap" before continuing in the original direction. Our system even notifies you when price enters an FVG, providing a high-probability entry signal.

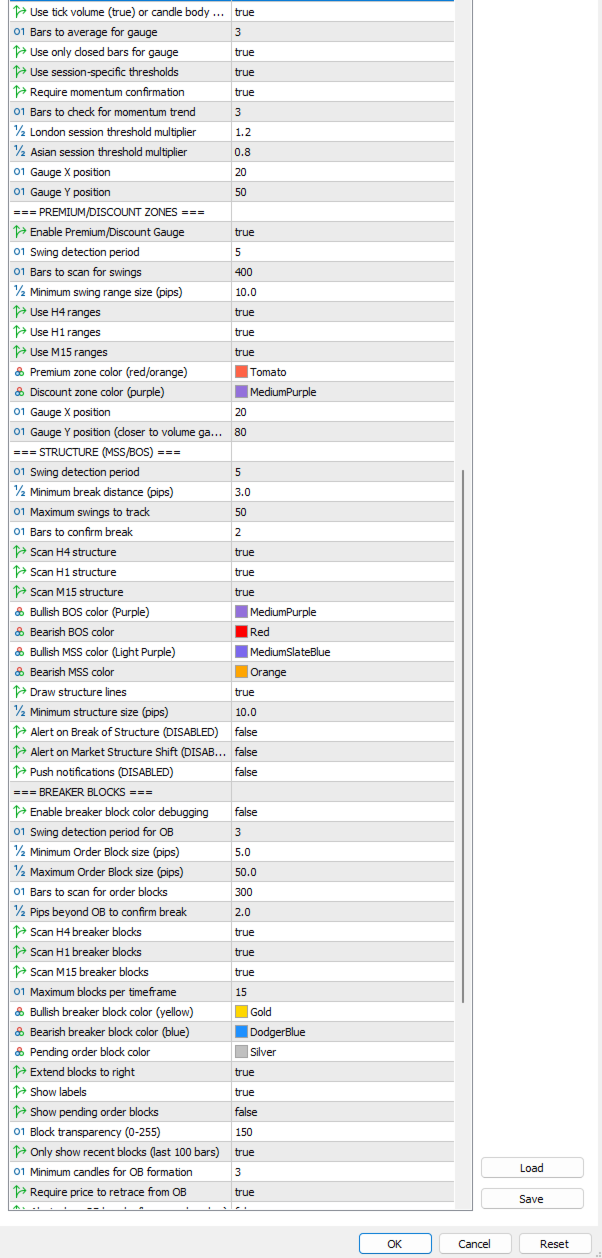
3. Market Structure & Breaker Blocks: Deciphering the Trend

  • What it does: We have combined two powerful concepts. The indicator first identifies a Break of Structure (BOS), which signals a continuation of the current trend. More importantly, it also detects a Market Structure Shift (MSS), which is the most critical signal of a potential trend reversal. It also identifies Breaker Blocks, which are old support or resistance zones that have been broken and "flipped" to a new role.

  • How it helps you: Understanding market structure is the foundation of profitable trading. Without it, you are trading blind. This feature helps you see the true trend and identifies the exact moment when the market's bias shifts. A Breaker Block provides a powerful, high-probability entry point after a trend reversal has been confirmed, as smart money often retests these levels before continuing a new move. 

  • The Volume & Premium/Discount Gauges: Analyzing Confluence

  • What it does: These aren't just standalone tools; they are powerful filters that add "confluence" to your analysis.

    • The Volume Gauge analyzes bullish vs. bearish volume to measure true market conviction behind a price move.

    • The Premium/Discount Gauge uses recent market swings to tell you if the current price is "cheap" or "expensive," helping you avoid buying at highs and selling at lows.

  • How it helps you: An institutional trader never trades a single signal. They wait for multiple factors to align. These gauges provide that crucial secondary confirmation. For example, a bullish FVG signal is much stronger when the volume gauge confirms bullish momentum and the price is in a Discount Zone.

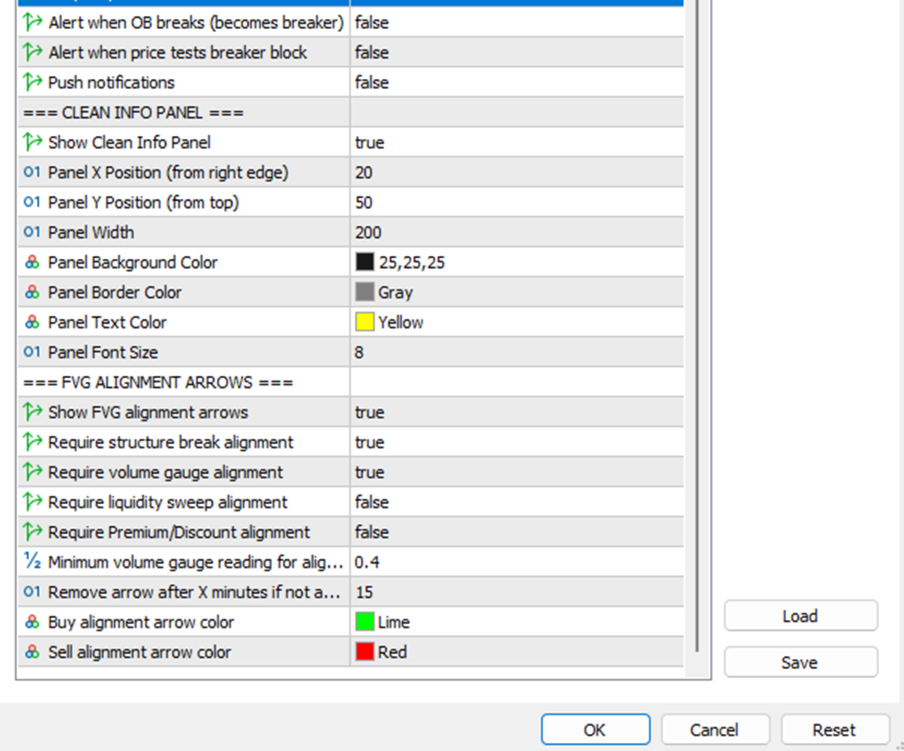
5. Smart Alignment Signals: Your All-in-One "Trigger"

  • What it does: This is the most innovative feature. Instead of cluttering your chart with multiple entry signals, the indicator waits for a confluence of factors to align, based on your custom settings. When an FVG lines up with a recent structure break, and the volume gauge confirms momentum, it generates a single, clean "Buy Setup" or "Sell Setup" arrow.

  • How it helps you: This feature cuts through the noise and gives you a single, high-quality signal to act on. It removes the emotional pressure of looking for trades and automates the process of finding the highest-probability setups. This powerful combination of institutional concepts and smart filtering gives you a decisive edge in the market.

In short, the Ultimate Smart Money Concepts Suite is the perfect tool for any trader looking to move beyond basic price action and start seeing the market from an institutional perspective. By automatically identifying, analyzing, and filtering the most important SMC data, it helps you find better entries, manage risk more effectively, and trade with the confidence of knowing you are aligned with the flow of smart money.


Recommended products
The Hybrid Trend Impulse indicator is an advanced tool that combines modern approaches to trend and impulse analysis, offering unique capabilities for effective deposit management. Key advantages of the HybridTrendImpulse_indicator: Nonlinear dynamics: The method of interaction between opening prices forms a unique nonlinear model that is particularly sensitive to significant price fluctuations, increasing their significance and making the indicator ideal for working in high volatility conditio
Shock Pullback
Suleiman Alhawamdah
Shock Pullback Indicator - A True Breakthrough in Market Analysis & a  fully integrated analysis system The Shock Pullback Indicator is a genuine breakthrough in detecting pullbacks and accumulation zones. Built on a completely innovative algorithm, it empowers traders to identify trading opportunities, track price movements, and detect pullbacks, accumulation zones, gaps, and breakouts with ease and absolute clarity. New Update Shock Pullback V 3.0: A radical and comprehensive update to make th
##   ONLY GOLD ##   Тiльки Золото ## **Mercaria Professional Trading Zones - Complete Guide** ## **Mercaria Professional Trading Zones - Повний посібник** ### **How Mercaria Zones Work / Як працюють зони Mercaria** **English:** Mercaria Zones is an advanced trading indicator that identifies high-probability support and resistance areas using ZigZag extremes combined with mathematical zone calculations. The indicator works on multiple timeframes simultaneously, providing a comprehensive view
Inguz
Maxim Kuznetsov
Ing (inguz,ingwar) - the 23rd rune of the elder Futhark ᛝ, Unicode+16DD. Add some runic magic to your trading strategies. The correct marking of the daily chart will indicate to you the successful moments for counter-trend trading. Simple to use, has high efficiency in volatile areas. Be careful in lateral movements. Signals ᛝ are generated when the main lines of construction intersect. Red arrow down - recommended sales Blue up arrow - recommended purchases rare purple arrows indicate exce
Advanced Trading Chaos  The main purpose of the indicator is to help the trader detect the signals described by Bill Williams in his books to make a quick and correct trading decision. 1)Bullish/Bearish Reversal Bar(BDB) 2) Divergent Bar(DB) 3) Second Sage Signal — the third consecutive Awesome Oscillator bar  4) Working fractals (Fractals that worked above/below the red forehead  5) Three bar coloring modes 5.1) Coloring of bars according to the AO indicator (Including the squatting bar) 5.2
Owl Smart Levels MT5
Sergey Ermolov
3.97 (31)
MT4 version  |   FAQ The Owl Smart Levels Indicator is a complete trading system within the one indicator that includes such popular market analysis tools as Bill Williams' advanced fractals , Valable ZigZag which builds the correct wave structure of the market, and Fibonacci levels which mark the exact levels of entry into the market and places to take profits. Detailed description of the strategy Instructions for working with the indicator Advisor-assistant in trading Owl Helper Private User
The "RMA Signal Indicator MT5" refers to an indicator called "RMA" (Running Moving Average) Signal Indicator designed specifically for the MetaTrader 5 (MT5) trading platform. The RMA is a variation of the Moving Average indicator that emphasizes recent price data. The specific details and functionality of the "RMA Signal Indicator MT5" may depend on the developer or the version you are using. However, in general, here is a general approach to using a signal indicator like RMA on the MT5 platfor
Gioteen Volatility Index (GVI) - your ultimate solution to overcoming market unpredictability and maximizing trading opportunities. This revolutionary indicator helps you in lowering your losing trades due to choppy market movements. The GVI is designed to measure market volatility, providing you with valuable insights to identify the most favorable trading prospects. Its intuitive interface consists of a dynamic red line representing the volatility index, accompanied by blue line that indicate
VarMomentPulse is a unique manual trading algorithm developed with precision and flexibility in mind, based on an extensive historical data cluster.  Its operation is grounded in the principles of analyzing crossovers between normalized moving averages and dispersions across various time intervals, enabling it to uncover new opportunities in evaluating market trends. Key Features of the VarMomentPulse Indicator: Adaptability to Volatility:The use of price dispersion analysis allows VarMomentPul
SlopeChannelB MT5
MIKHAIL VINOGRADOV
SlopeChannelB – a technical analysis tool that constructs a sloping price movement channel, offering unique opportunities to assess the current market situation and find trading signals. Main features of the indicator: Sloping price movement channel : The indicator helps visualize support and resistance levels, which may indicate potential reversal points or trend continuations. Various line colors and background highlighting : Sloping support and resistance levels are displayed in differen
Premium level is a unique indicator with more than 80% accuracy of correct predictions! This indicator has been tested for more than two months by the best Trading Specialists! The author's indicator you will not find anywhere else! From the screenshots you can see for yourself the accuracy of this tool! 1 is great for trading binary options with an expiration time of 1 candle. 2 works on all currency pairs, stocks, commodities, cryptocurrencies Instructions: As soon as the red arrow app
Rainbow EA MT5
Jamal El Alama
Description : Rainbow EA MT5 is a simple Expert advisor based on   Rainbow MT5 indicator witch is based on Moving average with period 34. The indicator is incorporated in the EA, therefore, it is not required for the EA to operate, but if you wish, you can download it from   my product page . The Expert Advisor settings are as follows : Suitable for Timeframes up to H1 The parameters below can be set according to your trading rules. StopLoss ( Stop Loss in pips) TakeProfit ( Take Profit in pips
ATR Line
Evgeny Levchenko
The indicator - "ATR Line" determines the current trend and gives signals to buy (green arrow to the top) or sell (red arrow to the bottom). The indicator calculation is based on the deviation of the average price of the instrument from its average true range - ATR. The moving average of prices is used to reduce "market noise". If the main line of the indicator - "ATR Line" is lower the instrument price chart, then the market is in a "bullish" trend. If the main line of the indicator is higher t
r-Trend Sync indicator is manual trading system for extra volatility markets. Main System features : The indicators's algorithm is based on the analysis of an extensive array of historical data (from 1995 for EURUSD & EURJPY and from 2004 for XAUUSD), which ensured the identification of general patterns in the behavior of these pairs across a wide range of timeframes. The analysis of historical data helped the system learn to recognize market triggers for medium-term trends and cycles, as well a
All-in-One Chart Patterns Professional Level: The Ultimate 36-Pattern Trading System All-in-One Chart Patterns Professional Level is a comprehensive 36-pattern indicator well known by retail traders, but significantly enhanced with superior accuracy through integrated news impact analysis and proper market profile positioning. This professional-grade trading tool transforms traditional pattern recognition by combining advanced algorithmic detection with real-time market intelligence.  CORE FEATU
Engulfing with EMAs Indicator Unlock the power of advanced candlestick pattern detection with the Engulfing with EMAs Indicator , a cutting-edge tool designed for MetaTrader 5. This futuristic indicator combines the precision of engulfing pattern analysis with the trend-following strength of Exponential Moving Averages (EMA 21 and EMA 50), empowering traders to identify high-probability setups across all currency pairs and timeframes. Key Features: Comprehensive Engulfing Detection : Detects b
Noize Absorption Index - is the manual trading system that measures the difference of pressure between bears forces and bulls forces. Green line - is a noize free index that showing curent situation. Zero value of index shows totally choppy/flat market.Values above zero level shows how powerfull bullish wave is and values below zero measures bearish forces.Up arrow appears on bearish market when it's ready to reverse, dn arrow appears on weak bullish market, as a result of reverse expectation.
The indicator detects divergence signals - the divergences between the price peaks and the MACD oscillator values. The signals are displayed as arrows in the additional window and are maintained by the messages in a pop-up window, e-mails and push-notifications. The conditions which formed the signal are displayed by lines on the chart and in the indicator window. The indicator parameters MacdFast - fast MACD line period MacdSlow - slow MACD line period MacdSignal - MACD signal line period Macd
ChartScalper
Magdalena Estefania Colonna
Chart Scalper v1.01 Professional Trading Indicator for MetaTrader 5 OVERVIEW Chart Scalper is an advanced technical indicator designed to accurately identify optimal market entry and exit points. Using a sophisticated price reversal analysis algorithm, the indicator automatically detects significant trend changes and generates clear visual signals for buy and sell trades. KEY FEATURES Accurate Trading Signals Automatically detects trend reversals based on configurable parameters Generates
PipFinite Binary Options PRO MT5
Karlo Wilson Vendiola
4.29 (14)
This LEGIT Indicator Can Accurately Predict the Outcome of One Bar. Imagine adding more filters to further increase your probability! Unlike other products, Binary Options PRO can analyze past signals giving you the statistical edge. How Increase Your Probability Information revealed here www.mql5.com/en/blogs/post/727038 NOTE: The selection of a Good Broker is important for the overall success in trading Binary Options. Benefits You Get Unique algorithm that anticipates price weakness. Gene
STRICTLY FOR BOOM INDEX ONLY!!!!! Here I bring the Maximum Trend Arrows OT1.0 MT5 indicator. This indicator is made up of a combination of different trend indicators for entries and exits, for entries an orange arrow will paint on the chart below the current market and a red flag for closing of trades and it produces buy arrows only. When the orange arrow appears, it will appear along with it's sound to notify you. The 1H timeframe is recommended, don't use it anywhere else than on the 1H timefr
The indicator displays a matrix of indicators across multiple timeframes with a sum total and optional alert. Custom indicators can also be added to the matrix, in a highly configurable way. The alert threshold can be set to say what percentage of indicators need to be in agreement for an alert to happen. The alerts can turned on/off via on chart tick boxes and can be set to notify to mobile or sent to email, in addition to pop-up. The product offers a great way to create an alert when multiple
Advanced 4xZeovo MT5 Indicator (MetaTrader 5)   Product Description  4xZeovo is a powerful trading indicator system monitoring 24/7 financial markets. Metatrader5 tool designed to find the best buying/selling opportunities and notifies the user.    Making life easy for traders in helping with the two most difficult decisions with the use of advanced innovate trading indicators aiming to encourage users to hold the winning positions and take profit at the best times.    Equipped with a unique tra
This indicator is based on a classic Moving Average indicator. Moving averages help us to first define the trend and second, to recognize changes in the trend. Multi TimeFrame indicator MTF-MA shows MA data from the 4 timeframes by your choice. By default this indicator has external parameters: TF1 = 1; TimeFrame2b = true; TF2 = 5; TimeFrame3b = true; TF3 = 15; TimeFrame4b = true; TF4 = 60; InpPSARStep = 0.02; InpPSARMaximum = 0.2; You can change TF1-TF4 in the next limits: TF1 from M1 (1) to H4
Overview The Multi Level ATR and Moving Average Band Indicator is a powerful tool for traders seeking to identify market trends, support, resistance levels, and volatility with clarity. This indicator combines multiple moving averages with ATR (Average True Range) multipliers to generate visually distinct bands around price movements. It helps traders spot potential reversal zones, trending conditions, and market consolidation areas. Features Multi-Band Display: Shows six dynamic bands derived f
FREE
Kingtrend
Antonio Blazquez
KingTrend — Price Action Trend Analysis Tool KingTrend is a trend-following indicator based on long-standing price action principles involving Highs, Lows, Open, and Close. The logic behind this tool comes from concepts passed on to me by my mentor and translated into code for consistent structure recognition. Features: Identifies market structure using price action logic Detects trend direction and key turning points Marks Higher Highs, Lower Lows, and extensions Suitable for discretionary or
https://youtu.be/JJanqcNzLGM ,  https://youtu.be/l70MIHaQQa4 ,  https://youtu.be/pg0oiT5_8y0   Automated Supply and Demand Trading Edge MT5. These videos demonstrate how we apply the supply and demand system to our latest trading review and market analysis Enhance your Trading Strategy with the Supply and Demand Trading Edge MT5. Gain a competitive market advantage with the Supply and Demand Trading Edge MT5 indicator, a powerful tool that combines MACD signals with supply and demand zones. By
HiLo Activator Plus
Rodrigo Galeote
5 (1)
HiLo Activator is one of the most used indicators to determine trend. Find it here with the ability to customize period and colors. This indicator also plots up and down arrows when there is a change on the trend, indicating very strong entry and exit points. HiLo fits well to different types of periods for day trading. You can easily understand when it is time to buy or sell. It works pretty good also for other periods like daily and monthly signalizing long-term trends. The use of the indicato
SMMA Bands Indicator
Elie Baptiste Granger
The SMMA Bands indicator is an advanced volatility-based trading tool that creates 6 dynamic support and resistance levels around an envelope formed by two Smoothed Moving Averages (SMMA).  This indicator combines the reliability of SMMA trend identification with the precision of standard deviation-based volatility bands, making it suitable for both trend-following and mean-reversion strategies. Every band has its own buffer for use in EA. feel free to make suggestions and add reviews , i will
The RSI Divergence + FVG Signal indicator combines Relative Strength Index (RSI) Divergence with Fair Value Gap (FVG) detection to generate high-probability buy and sell signals based on both momentum shifts and institutional imbalance zones. Core Features: RSI Divergence Detection : Identifies both regular and hidden bullish/bearish divergences between price and RSI. Divergences indicate potential trend reversals or continuation. FVG Zone Recognition : Detects Fair Value Gaps (imbalances caused
Buyers of this product also purchase
The " Dynamic Scalper System MT5 " indicator is designed for the scalping method of trading within trend waves. Tested on major currency pairs and gold, compatibility with other trading instruments is possible. Provides signals for short-term opening of positions along the trend with additional price movement support. The principle of the indicator. Large arrows determine the trend direction. An algorithm for generating signals for scalping in the form of small arrows operates within trend wav
ARIPoint
Temirlan Kdyrkhan
ARIPoint is a powerful trading companion designed to generate high-probability entry signals with dynamic TP/SL/DP levels based on volatility. Built-in performance tracking shows win/loss stats, PP1/PP2 hits, and success rates all updated live. Key Features: Buy/Sell signals with adaptive volatility bands Real-time TP/SL/DP levels based on ATR Built-in MA Filter with optional ATR/StdDev volatility Performance stats panel (Success, Profit/Loss, PP1/PP2) Alerts via popup, sound, push, or email Cu
ARIScalping
Temirlan Kdyrkhan
ARIScalp is a powerful trading companion designed to generate high-probability entry signals with dynamic TP/SL/DP levels based on volatility. Built-in performance tracking shows win/loss stats, PP1/PP2 hits, and success rates all updated live. Key Features: Buy/Sell signals with adaptive volatility bands Real-time TP/SL/DP levels based on ATR Built-in MA Filter with optional ATR/StdDev volatility Performance stats panel (Success, Profit/Loss, PP1/PP2) Alerts via popup, sound, push, or email Cus
Big Player Range
Thalles Nascimento De Carvalho
5 (3)
BigPlayerRange — Best Indicator for Micro Index and Micro Dollar | MT5 Unlock the power of BigPlayerRange , widely recognized as the best institutional indicator for the micro index and micro dollar on MetaTrader 5. This powerful tool highlights strategic zones of institutional activity, providing ultra-precise market structure insights. How It Works: BigPlayerRange draws two horizontal zones based on institutional volume action: Green Zone — Where institutional buyers defend the price.
Weis Wave with Alert MT5
Trade The Volume Waves Single Member P.C.
4.94 (16)
Rental/Lifetime Package Options and Privileges  Rent Monthly Six Months   Yearly/Lifetime Weis Wave with Speed with Alert+Speed Index x x x Manual  x x x Quick Set up Video x x x Blog x x x Lifetime Updates x x x Setup and Training Material x x Discord Access Channel "The SI traders"          x Rectangle Break Alert Tool      x How to trade with it:    http://www.tradethevolumewaves.com   ** If you purchase please contact me to setup your  : Training Room and  complete manual access.  Wei
A tool for on-chart strategy backtesting and performance analysis. A utility for developing, debugging, and testing custom trading ideas and indicator functions. An indicator designed to quickly test trading concepts and visualize the effectiveness of different input parameters. An all-in-one sandbox for testing everything from simple crossovers to complex, multi-condition trading systems.
Enigmera MT5
Ivan Stefanov
3.67 (3)
ENIGMERA: The core of the market (This is a manual indicator and contains features that are not supported by the MetaTrader testing environment) Introduction This indicator and trading system is a remarkable approach to the   financial markets . ENIGMERA uses the fractal cycles to accurately calculate support and resistance levels.   It shows the authentic accumulation phase and gives direction and targets.    A system that works whether we are in a trend or a correction.   How It Works Most
The indicator highlights zones where interests are being declared then shows their accumulation zone. It works like an order book in big scale. This is the indicator for the biggest money. It's performance is exceptional. Whatever interest there is in the market you will see it. ( This is a fully rewritten, automated version—manual analysis is no longer required.)  The Transaction Speed is a new concept indicator that shows where and when large orders accumulates on the market and benefits o
VTrende Pro
Andrii Diachenko
5 (1)
VTrende Pro - MTF indicator for trend trading with a display panel for MT5 *** Videos can be translated into any language using subtitles (video language - Russian) Although the signals of the VTrende Pro indicator can be used as signals of a full-fledged trading system, it is recommended to use them in conjunction with the Bill Williams TS. VTrende Pro is an extended version of the VTrende indicator. Difference between Pro version and VTrende: - Time zones - Signal V - signal 1-2 waves -    S
This indicator is based on the mathematics of the great trader W.D. Ganna. With its help, you can easily find strong levels by analyzing swings to find the optimal entry point. The indicator works on all instruments and all timeframes. The indicator is fully manual and has control buttons. All you need to do is press the NEW button, a segment will appear, which you can place on any movement, swing or even 1 candle that you want to analyze. By placing the segment, press the OK button. A grid (th
Get the FREE AUX Indicator, EA Support & Manual Guide please visit - https://www.mql5.com/en/blogs/post/763955 Spot the Trend. Read the Pattern. Time the Entry. 3 Steps in Under 30 Seconds! Trade effortlessly — no analysis required, Your smart assistant is ready to simplify your workflow No more chart overload. Trade with confidence using smart bias detection. Compatible with all currencies, crypto, stocks, metals, indices, and any timeframe. Just click and execute — it’s that simple. Deal for
The indicator is designed to work on any trading platform. The program is based on proprietary algorithms and W.D.Ganna's mathematics, allowing you to calculate target levels of price movement based on three points with the highest degree of certainty. It is a great tool for stock trading. The indicator has three buttons: NEW - call up a triangle for calculation. DEL - delete the selected triangle. DELS - completely remove all constructions. The probability of achieving the goals is more than 80
This indicator identifies and displays zones, as it were areas of strength, where the price will unfold. The indicator can work on any chart, any instrument, at any timeframe. The indicator has two modes. The indicator is equipped with a control panel with buttons for convenience and split into two modes. Manual mode: To work with manual mode, you need to press the NEW button, a segment will appear. This segment is stretched over the movement and the LVL button is pressed. The level is displayed
SupportResistancePeaks Indicator indicator - is the combination of dynamic support/resitance and price action pattern. As a rule support/resistance indicators uses already calculated, history levels. The most disadvantage of this method - new(incomming) levels always are not the same as were on history, in other words accuracy is not so high as expected. My indicator is looking for dynamic/live levels that are forming right now after trend lost it's power and choppy market starts. As a rule exac
Jeslyn MT5
Justine Kelechi Ekweh
This is a multi-purpose system that suits both Binary options, and Forex. Manual traders can use this either as a scalping system or a strategy to get into very strong momentum, or it can be automated for forex trading with Universal EAs.   This is a less-risky system if you know what to do with it or just use a universal EA. Use on M5 timeframe There is of course no chance of repainting or recalculation. Once the price closes, the arrows remain there forever! This is because prices don't lie.
The Second-Level Tick Candlestick Generator is a professional-grade MT5 indicator tool specifically designed for high-frequency trading and short-term scalping. It can convert raw tick data into highly customizable second-level candlestick charts in real-time, helping traders accurately capture micro-market fluctuations and optimize entry and exit timing. This tool provides clear chart displays, allowing you to more intuitively identify price action patterns and improve trading decision efficien
Bullhouse Marketprofile
Luiz Vinicius Pereira Rocha -
# Bullhouse MarketProfile Volume Profile, Simplicity, and Precision. Developed by Bullhouse, this indicator brings the power of Market Profile analysis to your MetaTrader 5 in a clean, intuitive, and highly customizable interface. --- ## What is Market Profile? Market Profile is a charting tool that displays the distribution of traded volume over time at each price level. It helps traders understand where the most buying and selling is happening and identify: - Value Areas - Points o
IVISTscalp5
Vadym Zhukovskyi
5 (6)
What's new about iVISTscalp5 forecast indicator (Version 10)? iVISTscalp5 is a unique nonlinear forecasting for a week ahead system for any financial instrument which executes fast scalping using time levels. iVISTscalp5 is a tool for easy study and understanding of financial market. 1) iVISTscalp5 forecast indicator has been completely rewritten into another programming language (C++), which has accelerated data loading and processing. As a result, a different graphical display of forecasts
Reversal ALGO
Muhammad Abdullah Bhatti
Reversal Algo – Technical Indicator for Market Reversal Analysis Overview Reversal Algo is a sophisticated technical indicator meticulously engineered to help traders identify potential turning points in market trends. By thoroughly analyzing historical price data, it detects significant highs and lows that may signal an impending shift in market momentum. This indicator provides clear and distinct visual signals on your charts, allowing you to pinpoint key areas where trends might reverse. Des
SYSTEM INTRODUCTION:   The Binary Options Momentum System Is Specifically Designed For Binary Options Trading. Unlike Other Systems And Indicators That Were Adopted From Other Trading Environments For Binary Options. Little Wonder Why Many Of Such Systems Fail To Make Money . Many End Up Loosing Money For Their Users.  A Very Important Fact That Must Be Noted Is The Fact That Application Of Martingale Is not Required. Thus Making It Safer For Traders Usage And Profitability. A Trader Can Use Fi
Core Concept: Naveen Saroha's Advanced time and price angles are drawn from significant highs or lows at specific geometric ratios that represent the relationship between price movement and time. The Main Gann Angles and Percentage together Most Important: 1x1 Angle : One units of price for one unit of time  1x2 Angle : One unit of price for two units of time  1x3 Angle 1x4 Angle 1x5 Angle 1x6 Angle 1x7 Angle 1x8 Angle: (45) : Eight unit of price for one unit of time - considered the most i
Channel Trend Bands – A Comprehensive Indicator for Market Analysis MetaTrader 4 Version Simple to Use, Effective in Application User-Friendly and Suitable for All Traders This indicator stands out due to its straightforward functionality. Whether you're a beginner exploring the market or an experienced trader refining your strategy, this tool offers valuable insights. Using a   Triangular Moving Average (TMA)   with additional   ATR-based bands , it provides structured market data to support w
Multi-Timeframe Bollinger Bands Indicator Enhance your trading analysis with our Multi-Timeframe Bollinger Bands indicator for MQL5! This powerful tool allows you to visualize Bollinger Bands across five different timeframes simultaneously, all using the same period setting . Gain a clearer understanding of market volatility and potential trend reversals at a glance. Simplify your multi-timeframe analysis and make more informed trading decisions.
The indicator is designed to close positions on the market in time. For example: to take profits ahead of schedule if the price has not reached TakeProfit, and the market is turning around. The indicator analyzes the momentum, not the trend. He does not give any information about the trend. The indicator is well suited for finding divergence. The Ershov 38 Parrots indicator dynamically adjusts to the market and detects price movement impulses of medium and high amplitude. It almost does not rea
Trend Compass MT5
Paul Edunyu Carissimo
Trend Compass: All-in-One Trend Tracking The Trend Compass indicator is a sophisticated yet user-friendly trading tool designed for both novice and experienced traders. By combining multiple technical analysis approaches into one comprehensive package, it eliminates the need for multiple indicators cluttering your charts. Key Features: Multiple analysis modes including VSA for effort/result evaluation Dynamic trailing stops using fractal levels Seven color visualization options for clear market
XCalper TFO
Aecio de Feo Flora Neto
This oscillator was developed exclusively by xCalper in 2015 based on moving averages calculations to indicate and try predicting oversold and overbought levels. The fast line (white, by default) oscillates basically between values -0.5 (oversold) and +0.5 (overbought). Whenever this line crosses upward value -0.5, it means an oversold price level. When it crosses downward value +0.5, it means an overbought price level. When fast line crosses value 0.0 and returns, it is a strong pull-back indic
Smooth price for Monarch
Konstantin Gruzdev
5 (1)
The Smooth Price technical indicator is used for plotting a smoothed line as close to the price of the financial instrument as possible, and serves to eliminate its noise components. The indicator is part of the Monarch trading system, but here it is presented as an independent technical analysis tool. The indicator is based on the cluster digital filter , which, unlike the ClusterSMA , is applied directly to the price time series. Smooth Price does not redraw (except the very last, zero bar) an
The Expert Advisor and the video are attached in the Discussion tab . The robot applies only one order and strictly follows the signals to evaluate the indicator efficiency. Pan PrizMA CD Phase is an option based on the Pan PrizMA indicator. Details (in Russian). Averaging by a quadric-quartic polynomial increases the smoothness of lines, adds momentum and rhythm. Extrapolation by the sinusoid function near a constant allows adjusting the delay or lead of signals. The value of the phase - wave s
Классификатор силы тренда. Показания на истории не меняет. Изменяется классификация только незакрытого бара. По идее подобен полной системе ASCTrend, сигнальный модуль которой, точнее его аппроксимация в несколько "урезанном" виде, есть в свободном доступе, а также в терминале как сигнальный индикатор SilverTrend . Точной копией системы ASCTrend не является. Работает на всех инструментах и всех временных диапазонах. Индикатор использует несколько некоррелируемых между собой алгоритмов для класси
FFx Universal Strength Meter PRO is more than a basic strength meter. Instead of limiting the calculation to price, it can be based on any of the 19 integrated strength modes + 9 timeframes. With the FFx USM, you are able to define any period for any combination of timeframes. For example, you can set the dashboard for the last 10 candles for M15-H1-H4… Full flexibility! Very easy to interpret... It gives a great idea about which currency is weak and which is strong, so you can find the best pai
More from author
TradePanel EA – Manual + Semi-Auto Trading Dashboard TradePanel EA is a powerful assistant for traders who want precision, speed, and full control over their trades. It combines on-chart execution , basket profit management , drawdown protection , and market/session awareness into one easy-to-use panel. Core Features Click-to-Trade System Place BUY/SELL instantly from the panel Click on the chart to set Stop Loss — TP is auto-calculated by your chosen R:R Risk Control & Lot Sizing Risk
The Volumatic FVG indicator is an advanced tool for traders who use Fair Value Gaps (FVG) and Imbalance in their analysis. It automatically identifies and visualizes these gaps on your chart, providing crucial insights into market movements and potential price targets. Unlike basic FVG indicators, the Volumatic FVG enriches this analysis by incorporating volume data directly into each FVG box, helping you assess the strength and potential significance of each gap. This indicator is built to seam
Sniper entry on 5m TF with Higher Time Frame order blocks Volumetric Breaker Blocks: The Smart Money Catalyst  The Volumetric Breaker Blocks indicator is a sophisticated tool designed for traders who follow Smart Money Concepts (SMC) and Price Action . Unlike standard order block detectors, this indicator automatically identifies, validates, and visualizes Breaker Blocks across multiple timeframes, providing a powerful edge in your analysis. It is a purely analytical tool that visualizes key mar
Volume at Price (VbP) with Dynamic Analysis Suite This indicator goes beyond traditional volume profile tools by integrating real-time market analysis and a sophisticated scoring system. It visualizes volume distribution, pinpoints key price levels, and provides actionable insights based on volume, momentum, and divergence. This is the ideal tool for traders who want to confirm their entries and exits with institutional-level volume data. What It Does & Why It Helps You This suite is built to so
Filter:
No reviews
Reply to review