Market Condition Evaluation based on standard indicators in Metatrader 5 - page 75
You are missing trading opportunities:
- Free trading apps
- Over 8,000 signals for copying
- Economic news for exploring financial markets
Registration
Log in
You agree to website policy and terms of use
If you do not have an account, please register
Forum
Press review
newdigital, 2013.11.22 19:06
Breakout with Ichimoku (based on Take Advantage of False Breakouts at Great Prices with Ichimoku article)
If this is your first reading of the Ichimoku report, here is a recap of the traditional rules for a sell trade:
If the breakout turns out to be legitimate and 1.3550 is taken out, then the next target would be in the neighborhood of 1.3630 /3650 range.
Hi;newdigital
what is trigger line ?
it is not one of standard line of this indicator. can you please explain.
thank you.
this is explanation of tenkan/kijun lines location. On the image - black and light blue lines are tenkan/kijun, and bright green line is Chinkou Span.
Forum
USDJPY Technical Analysis 23.06 - 30.06 : Rally Finishing to Ranging
newdigital, 2013.06.27 12:07
Well ... what I am explaining here by text and charts - it is understandable for traders. But there are traders and coders on the forum. And I think we all know that they are using different "forex english" in some cases. So, I am just translating some terms/words I am using for technical Ichimoku analysis onto "coding english" language :) :
Forum
Something Interesting in Financial Video October 2013
newdigital, 2013.10.27 15:37
Ichimoku trading tenkan-sen kijun-sen cross Part 2Second part of the TK Cross video explaining about the Kumo future as a filter on your cross.
==================
Tenkan Sen / Kijun Sen Cross
The Tenkan Sen / Kijun Sen Cross signal occurs when the Tenkan Sen (Turning line) crosses the Kijun Sen (Standard line).
A bullish signal occurs when the Tenkan Sen crosses from below to above the Kijun Sen
- A weak bullish signal occurs when the cross is below the Kumo.
- A neutral bullish signal occurs when the cross is inside the Kumo.
- A strong bullish signal occurs when the cross is above the Kumo.
A bearish signal occurs when the Tenkan Sen crosses from above to below the Kijun SenKijun Sen Cross
The Kijun Sen Cross signal occurs when the price crosses the Kijun Sen (Standard line).
A bullish signal occurs when the price crosses from below to above the Kijun Sen
- A weak bullish signal occurs when the cross is below the Kumo.
- A neutral bullish signal occurs when the cross is inside the Kumo.
- A strong bullish signal occurs when the cross is above the Kumo.
A bearish signal occurs when the price crosses from above to below the Kijun Sen==================
Indicator for MT5 with alert is on this post.
AUDUSD (based on AUD/USD and NZD/USD Breakdown; Here are Trading Tactics article)
Trading Strategy: The first target was hit at .9250. The stop on the remainder is lowered to .9450. Plans are to add to the position above .9250.
USDJPY (based on AUD/USD and NZD/USD Breakdown; Here are Trading Tactics article)
Trading Strategy: I am long (trigger was 99.85). Stop is tightened to 99.55 and I am on the lookout for a chance to add to the position.
Forum
Press review
newdigital, 2013.11.27 11:19
2013-11-27 09:30 GMT (or 10:30 MQ MT5 time) | [GBP - Trade Balance]
if actual > forecast = good for currency (for GBP in our case)
==========
U.K. Q3 Growth Confirmed At 0.8%
The U.K. economy expanded 0.8 percent in the third quarter from the previous quarter, in line with the initial estimate published on October 25.
Gross domestic product grew at the fastest pace since the second quarter of 2010, and follows 0.7 percent growth in the second quarter of 2013, data from the Office for National Statistics showed Wednesday.
According to second estimates, GDP advanced 1.5 percent year-on-year, as initially estimated, in the third quarter.
MetaTrader Trading Platform Screenshots
GBPUSD, M5, 2013.11.27
MetaQuotes Software Corp., MetaTrader 5, Demo
GBPUSD M5 : 80 pips price movement by GBP - Trade Balance
Forum
Press review
newdigital, 2013.11.28 13:12
2013-11-28 08:00 GMT (or 09:00 MQ MT5 time) | [Spain - GDP]
if actual > forecast = good for currency (for EUR in our case)
==========
Spanish Q3 GDP Growth Confirmed At 0.1%
The Spanish economy exited recession in the third quarter of 2013 with the gross domestic product expanding 0.1 percent sequentially, final data from the statistical office Ine revealed Thursday.
This follows a 0.1 percent contraction in the second quarter and a 0.4 percent fall in the first quarter.
On an annual basis, the economy remained in negative territory. The GDP fell 1.1 percent year-on-year in the third quarter. This was revised from a 1.2 percent contraction reported initially. In the second quarter, GDP was down 1.6 percent.
MetaTrader Trading Platform Screenshots
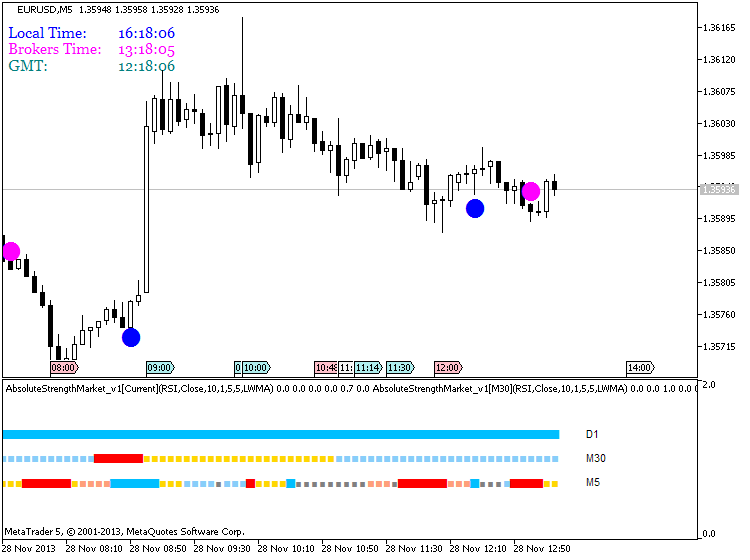
EURUSD, M5, 2013.11.28
MetaQuotes Software Corp., MetaTrader 5, Demo
EURUSD M5 : 38 pips price movement by Spain - GDP news event
On the image - Asctrend Market system for MT5 : this 38 pips price movement was also catchen by this system
I think most interesting pairs for the technical analysis for the next week are NZDUSD and GBPUSD.
=========
NZDUSD
D1 timeframe
Price is inside Ichimoku cloud below Sinkou Span A line/border for ranging bearish market condition trying to cross the other border of the cloud/kumo for primary bearish.
W1 timeframe
Exact same situation - the price is trying to go out of kumo. And Chinkou Span line came very close to historical price to be ready to cross it from above to below for good bearish breakdown.
MN1
It is bullish ranging but Chinkou Stan is crossing the price on open bar. If this Chinkou Span will cross historical price on cross bar so we may have good correction within primary bullish (good to open sell trades for example). But please note - one bar in MN timeframe = one month
=========
GBPUSD
D1 timeframe
Bullish
W1 timeframe
It was flat and ranging for past few weeks but primary bullish is started for now on open W1 bar
MN1
Chinkou Span line crossed historical price from below to above and price is located inside Ichimoku cloud/kumo. So, if Chinkou Span will cross the price on close monthly bar so we may have ranging breakout for MN timeframe (bullish breakout because the price is already above Sinkou Span A line which is indicating the bullish market condition for monthly timeframe).
That's all news
Forum
Press review
newdigital, 2013.12.04 09:09
2013-12-04 00:30 GMT (or 01:30 MQ MT5 time) | [AUD - GDP]
if actual > forecast = good for currency (for AUD in our case)
==========
Australia Q3 GDP Expands 0.6% On Quarter
Australia's gross domestic product was up a seasonally adjusted 0.6 percent in the third quarter of 2013 compared to the previous three months, the Australian Bureau of Statistics said on Wednesday.
The headline figure was shy of expectations for an increase of 0.7 percent following the 0.6 percent gain in the second quarter.
On a seasonally adjusted annualized basis, GDP was up 2.3 percent - also missing forecasts for an increase of 2.6 percent, which would have been unchanged from the previous three months.
MetaTrader Trading Platform Screenshots
AUDUSD, M5, 2013.12.04
MetaQuotes Software Corp., MetaTrader 5, Demo
AUDUSD M5 : 86 pips price movement by AUD - GDP
Forum
Press review
newdigital, 2013.12.05 13:43
Trading the News: European Central Bank Interest Rate Decision (based on dailyfx.com article)
The European Central Bank (ECB) is widely expected to adopt a more dovish tone for monetary policy as the Governing Council remains poised to implement more non-standard measures in 2014.
What’s Expected:
Time of release: 12/05/2013 12:45 GMT, 7:45 EST
Primary Pair Impact: EURUSD
Expected: 0.25%
Previous: 0.25%
Forecast: 0.25%
Why Is This Event Important:
Given the recent headlines surrounding the ECB, there may be little in terms of new surprises as the Governing Council looks at a range of policy tools (Negative Deposit Rates, Long-Term Refinancing Operations, and Quantitative Easing), but the Euro may struggle to hold its ground following the policy meeting should President Mario Draghi layout a more detailed schedule for its easing cycle.
Bearish EUR Trade: ECB Lays Out Detailed Easing Schedule
- Need to see red, five-minute candle following the decision/statement to consider a short Euro trade
- If market reaction favors a short trade, sell EURUSD with two separate position
- Set stop at the near-by swing high/reasonable distance from cost; at least 1:1 risk-to-reward
- Move stop to entry on remaining position once initial target is met, set reasonable limit
Bullish EUR Trade: Governing Council Adopts More Neutral TonePotential Price Targets For The Rate Decision
65 pips by this news event - see image below :
MetaTrader Trading Platform Screenshots
EURUSD, M15, 2013.12.05
MetaQuotes Software Corp., MetaTrader 5, Demo
temp_file_screenshot_39427.png