Forecast for Q1'16 - levels for EUR/USD
Forum on trading, automated trading systems and testing trading strategies
Sergey Golubev, 2015.12.29 08:27
EUR/USD Technical Analysis: Waiting to Confirm Head and Shoulders Pattern Before Triggering Short Trade (based on the article)
- "Near-term support is in the 1.0777-1.0818 area, marked by the May 27 low and the 23.6% Fibonacci expansion, with a break below that on a daily closing basis opening the door for a test of the 38.2% level at 1.0602. Alternatively, a push above the December 15 high at 1.1060 paves the way for a challenge of falling trend line resistance at 1.1201."
- "The Head and Shoulders setup requires a breach of neckline support at 1.0777 to become actionable, which has yet to materialize. Furthermore, the threat of risk aversion ahead represents a possibly potent catalyst for Euro gains amid the unwinding of carry trade positions. With that in mind, we will remain on the sidelines for the time being."
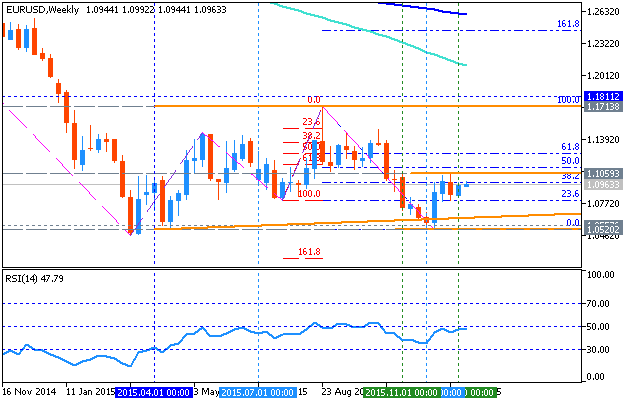
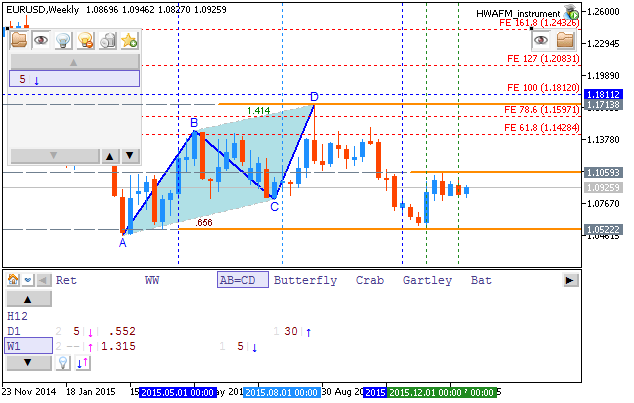
As we see from the chart above - the weekly price is on primary bearish market condition to be below 100 SMA/200 SMA, and 1.0803 support is 23.6% Fibo level which is located near and below the market price for now.
The bullish reversal resistance level is Fibo resistance at 1.1812, and if the price breaks it to above so the reversal of the price movement from the primary bearish to the primary bullish condition will be started.
By the way, the bearish 'reversal' level for this timeframe is Fibo support at 1.0520, and the price will be continuing with the bearish condition by breaking this level to below.
Forum on trading, automated trading systems and testing trading strategies
Sergey Golubev, 2015.12.29 14:51
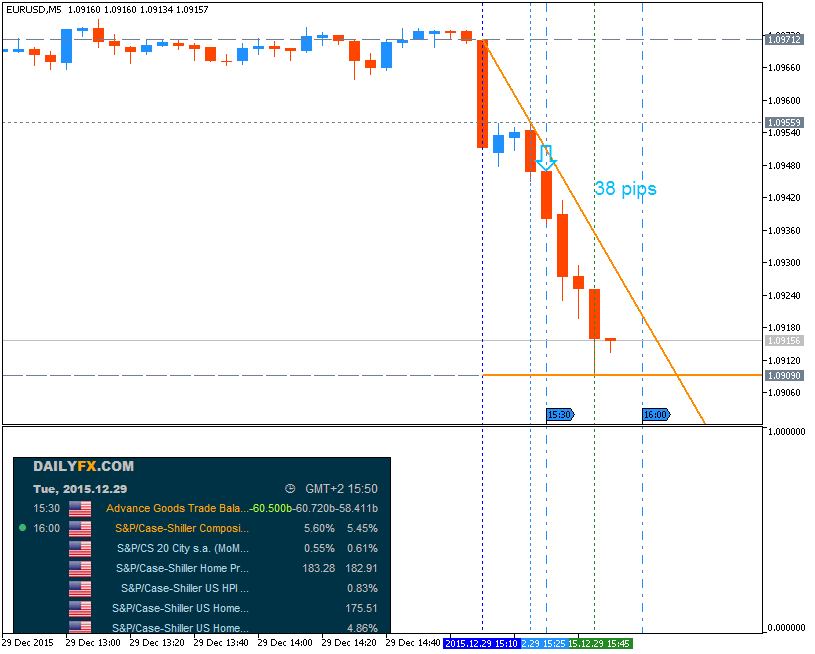
EUR/USD Intra-Day Fundamentals - International Trade in Goods and 38 pips price movement
2015-12-29 13:30 GMT | [USD - International Trade in Goods]
- past data is -58.4B
- forecast data is -60.7B
- actual data is -60.5B according to the latest press release
if actual > forecast (or previous one) = good for currency (for USD in our case)
[USD - International Trade in Goods] = Difference in value between imported and exported goods during the reported month.
==========
EURUSD M5: 38 pips price movement by USD - International Trade in Goods news event :
Forum on trading, automated trading systems and testing trading strategies
Sergey Golubev, 2015.12.29 17:10
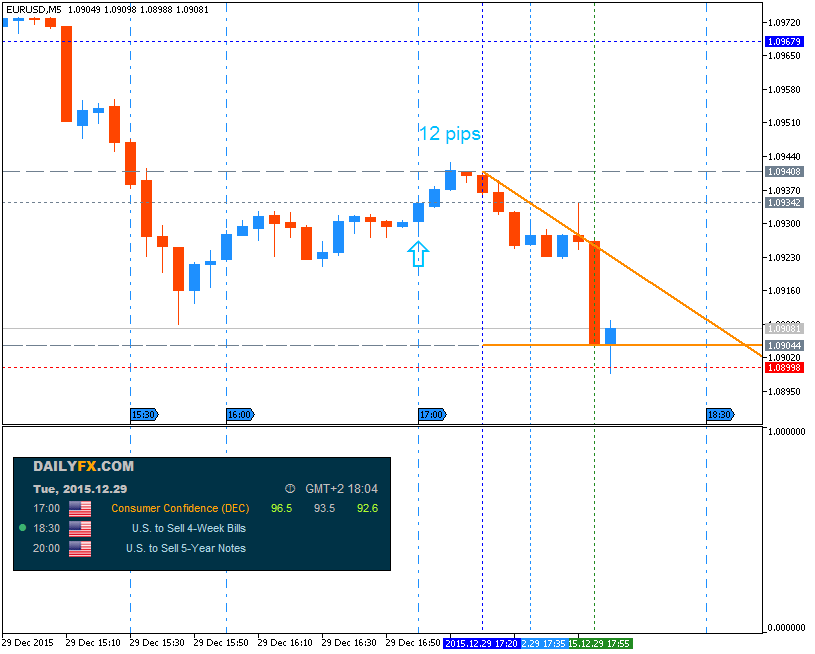
EUR/USD Intra-Day Fundamentals - Consumer Confidence and 12 pips price movement
2015-12-29 15:00 GMT | [USD - Consumer Confidence]
- past data is 92.6
- forecast data is 93.5
- actual data is 96.5 according to the latest press release
if actual > forecast (or previous one) = good for currency (for USD in our case)
[USD - Consumer Confidence] = Level of a composite index based on surveyed households.
==========
==========
EURUSD M5: 12 pips price movement by USD - Consumer Confidence news event :
Forum on trading, automated trading systems and testing trading strategies
Mohammad Soubra, 2015.12.30 01:30
Central Bank Calendar 2016
---
| 2016 | Jan | Feb | Mar | Apr | May | Jun | Jul | Aug | Sep | Oct | Nov | Dec |
|---|---|---|---|---|---|---|---|---|---|---|---|---|
| US Federal Reserve (FOMC) | 27 | - | 16 | 27 | - | 15 | 27 | - | 21 | - | 2 | 14 |
| European Central Bank (ECB) | 21 | - | 10 | 21 | - | 2 | 21 | - | 8 | 20 | - | 8 |
| Bank of England (BOE) | 14 | 4 | 17 | 14 | 12 | 16 | 14 | 4 | 15 | 13 | 3 | 15 |
| Swiss National Bank (SNB) | - | - | 17 | - | - | 16 | - | - | 15 | - | - | 15 |
| Bank of Canada (BOC) | 20 | - | 9 | 13 | 25 | - | 13 | - | 7 | 19 | - | 7 |
| Bank of Japan (BOJ) | 29 | - | 15 | 28 | - | 16 | 29 | - | 21 | - | 1 | 20 |
| Reserve Bank of Australia (RBA) | - | 2 | 1 | 5 | 3 | 7 | 5 | 2 | 6 | 4 | 1 | 6 |
| Reserve Bank of New Zealand (RBNZ) | 28 | - | 10 | 28 | - | 9 | - | 11 | 22 | - | 10 | - |
| Riksbank (SEK) | - | 11 | - | 21 | - | - | 5 | - | - | - | - | - |
| Norges Bank (NOK) | - | - | 17 | - | 12 | 23 | - | - | 22 | 27 | - | 15 |
Forum on trading, automated trading systems and testing trading strategies
Sergey Golubev, 2015.12.30 11:41
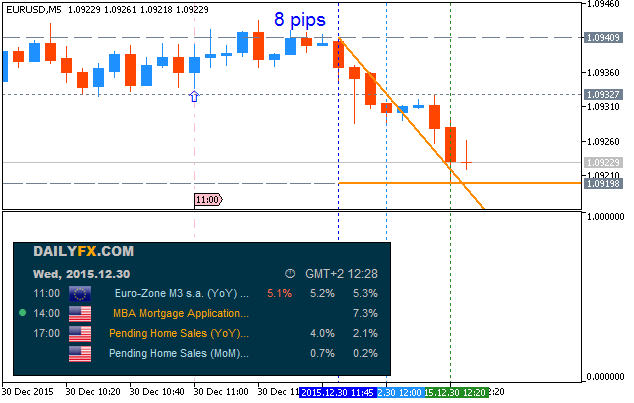
EUR/USD Intra-Day Fundamentals - M3 Money Supply and 8 pips price movement
2015-12-30 09:00 GMT | [EUR - M3 Money Supply]
- past data is 5.3%
- forecast data is 5.2%
- actual data is 5.1% according to the latest press release
if actual > forecast (or previous one) = good for currency (for JPY in our case)
[EUR - M3 Money Supply] = Change in the total quantity of domestic currency in circulation and deposited in banks. It's positively correlated with interest rates - early in the economic cycle an increasing supply of money leads to additional spending and investment, and later in the cycle expanding money supply leads to inflation.
==========
"The annual growth rate of the broad monetary aggregate M3 decreased to 5.1% in November 2015, from 5.3% in October, averaging 5.1% in the three months up to November. The components of M3 showed the following developments. The annual growth rate of the narrower aggregate including currency in circulation and overnight deposits (M1) decreased to 11.2% in November, from 11.8% in October. The annual growth rate of short-term deposits other than overnight deposits (M2-M1) was less negative at -4.1% in November, from -4.3% in October. The annual growth rate of marketable instruments (M3-M2) decreased to 2.6% in November, from 3.1% in October."

==========
EURUSD M5: 8 pips price movement by EUR - M3 Money Supply news event :
EUR/USD Intra-Day Technical Analysis - wranging within bearish/bullish reversal levels
M5 price is located near and below SMA with period 100 (100 SMA) and SMA with the period 200 (200SMA) with the bearish market condition ranging within the following key reversal support/resistance levels:
- 1.0933 resistance located above 100 SMA/200 SMA in the primary bullish area of the chart, and
- 1.0914 support level located below 100 SMA/200 SMA in the primary bearish area.
RSI indicator is estimating the ranging bearish condition to be continuing.
- If the price will break 1.0933 resistance level so the price will be reversed to the bullish market condition.
- If price will break 1.0914 support so the bearish trend will be continuing.
- If not so the price will be ranging within the levels.
| Resistance | Support |
|---|---|
| 1.0933 | 1.0918 |
| N/A | 1.0914 |
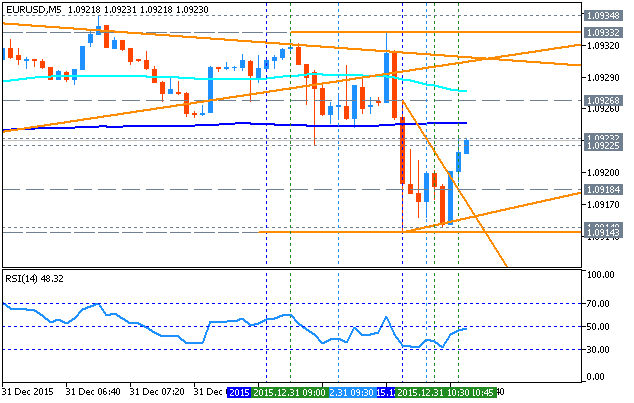
- Recommendation to go short: watch the price to break 1.0914 support level for possible sell trade
- Recommendation to go long: watch the price to break 1.0933 resistance level for possible buy trade
- Trading Summary: ranging
SUMMARY : ranging
Forum on trading, automated trading systems and testing trading strategies
Sergey Golubev, 2016.01.01 20:05
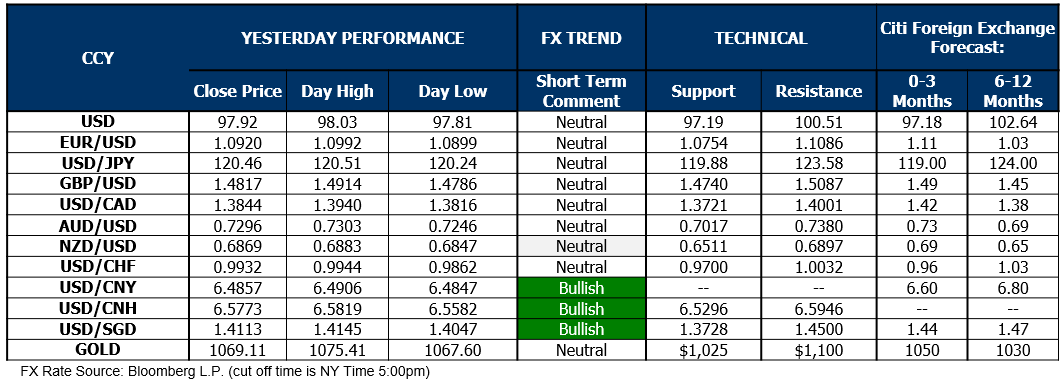
6 month forecast by Citi group for US Dollar, Forex and Gold (based on the article)
Forum on trading, automated trading systems and testing trading strategies
Sergey Golubev, 2016.01.03 13:30
Forex Weekly Outlook January 4-8 (based on the article)
2016 begins with a busy calendar: Canadian employment data, US PMIs, Trade Balance, FOMC Meeting Minutes and employment data culminating with the Non-Farm Payrolls. In addition, liquidity is set to return after the holiday season. These are the highlights opening 2016. Join us as we explore these market-movers.
U.S. consumer confidence edged up to 96.5 from 92.6 in November, beating market forecasts. Current conditions improved from 110.9 to 115.3 and the Expectations Index improved to 83.9 from 80.4 in November. Overall, consumers’ assessment of the current state of the economy remains positive. Meanwhile Jobless claims increased 20,000 during the holiday week due to temporary holiday factors. Economists expected a rise of 270,000. Analysts expect a slower pace of job market improvement in 2016 despite the low unemployment rate.
- Chinese Caixin Manufacturing PMI: Monday, 1:45. This independent report for the Chinese economy has worried investors during 2015, but did recover from the lows. After hitting 48.6 points in November, a rise to 48.9 is on the cards for December, still below the 50 point mark separating growth and contraction.
- US ISM Manufacturing PMI: Monday, 15:00. The U.S. manufacturing activity plunged in November to its worst levels since June 2009, when the index of national factory activity declined to 48.6 crossing the 50 point line for the first time since November 2012. The previous reading was 50.5. Economists expected the index to rise to 50.6. The employment section rose to 51.3 from 47.6 in October, new orders fell to 48.9, lowest since August 2012 and the prices paid index fell to 35.5 from 39. A score of 49.1 points is expected now.
- US ADP Non-Farm Employment Change: Wednesday, 13:15. Private sector employment increased by 217,000 jobs in November according to ADP Report. The reading topped market forecast and followed a 196,000 reading in the previous month. This was the strongest gains in the service sector since June. The increase was mainly driven by a rebound in professional/business service jobs. Job growth remains strong and the pace of job creation is twice that needed to absorb growth in the working age population. 193K is expected now.
- US Trade Balance: Wednesday, 13:30. The U.S. trade deficit widened unexpectedly in October amid a fall in exports. The trade gap increased 3.4% to $43.9 billion, resulting from a stronger dollar. September’s trade deficit was revised up to $42.5 billion from the previously reported $40.8 billion. Economists had expected an improvement to $40.6 billion. Exports fell 1.4% to $184.1 billion, the lowest level since October 2012. Imports slipped 0.6% to $228.0 billion in October. A deficit of 44 billion is expected.
- US ISM Non-Manufacturing PMI: Wednesday, 15:00. The U.S. service sector reflected slower business activity in November. The Institute for Supply Management’s non manufacturing purchasing-managers index fell to 55.9 from 59.1 in October. Economists expected the index to fall to 58.1. However, despite this decline, November’s reading shows the resilience of the domestic services sector. Business activity, new orders and employment components fell by more than 4 points, but still posted readings above 55.
- US FOMC Meeting Minutes: Wednesday, 19:00. These are the minutes from the historic rate hike decision. The statement showed a unanimous vote, but perhaps the wider array of members wasn’t in full agreement. It will be important to note the sentiment towards further rate hikes in 2016. Currently, 4 hikes are foreseen according to the dot plot, while markets expect far less activity. The Fed decided to put an emphasis on inflation, and we will also learn how worried they were at the time.
- US Unemployment Claims: Thursday, 13:30. Initial jobless claims in the U.S. increased by 20,000 last week to a seasonally adjusted 287,000. The increase was larger than the 274,000 initially expected. Meanwhile, the four-week moving average increased by 4,500 claims to 272,500. Continuing jobless claims edged up by 3,000 to a seasonally adjusted 2,198,000. A drop to 271K is predicted now.
- Canadian employment data: Friday, 13:30. The Canadian economy shed nearly 36,000 jobs in November after a massive part-time workers hired for the October federal election were dismissed. The job losses, were four times larger than the 10,000 expected raising the unemployment rate to 7.1%, from 7% in October. While the economy lost 72,000 part time workers, it also gained 36,000 full-time employees, suggesting the picture is not as bad as it looks. A gain of 10.4K jobs and steady unemployment rate at 7.1% are predicted now.
- US Non-Farm Employment Payrolls: Friday, 13:30. The last NFP report showed a 211,000 jobs gain in November, beating forecasts for a 201,000 increase, keeping the unemployment rate steady at 5%. The solid job gain was exactly what the Fed needed to make the call to raise rates on their December meeting. Wages increased 2.3% year-over-year in November a bit lower than the 2.5% rise posted in October showing a growth trend. A gain of 202K jobs is predicted with a steady unemployment rate of 5%. Wages are expected to rise 0.2% m/m once again. While no hike is expected in the January meeting, this feeds into the March decision.
EURUSD Intra-Day Technical Analysis - ranging bearish on reversal
H4 price is on primary bearish market condition for the ranging within the following key support/resistance levels:
- 1.0992 resistance located above Ichimoku cloud in the primary bullish area of the chart, and
- 1.0827 support level located below Ichimoku cloud in the primary bearish area.
Chinkou Span line is below the price indicating the bearissh ranging trend to be continuing, and descending triangle pattern was formed by the price for the bearish breakdown in the near future. Trend Strength indicator is estimating the bearish trend, and Absolute Strength indicator is forecasting the bear market rally to be started.
| Resistance | Support |
|---|---|
| 1.0936 | 1.0845 |
| 1.0992 | 1.0827 |
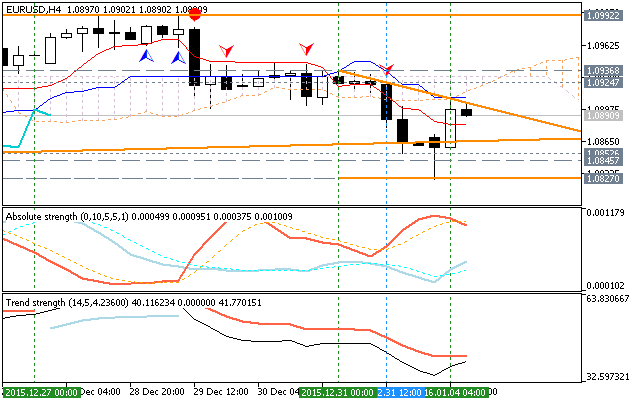
If
H4 price will break 1.0827 support level on close H4 bar so the primary bearish trend will be continuing.
If H4 price will break 1.0992 resistance level so we may see the reversal to the primary bullish
condition.
If not so the price will be ranging within the levels.
- Recommendation for long: watch close H4 price to break 1.0992 for possible buy trade
- Recommendation
to go short: watch H4 price to break 1.0827 support level for possible sell trade
- Trading Summary: ranging
SUMMARY : bearish
Forum on trading, automated trading systems and testing trading strategies
Sergey Golubev, 2016.01.04 11:01
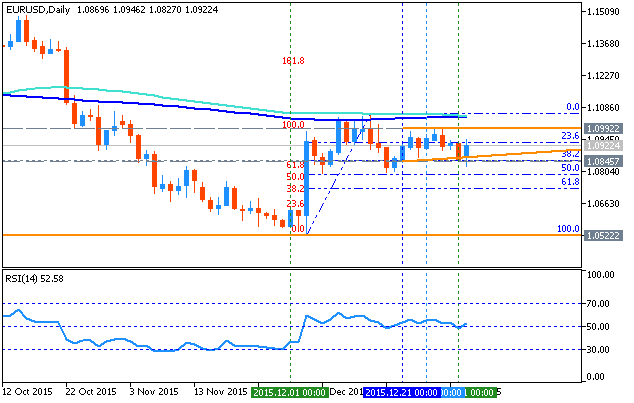
EUR/USD Technical Analysis: daily ranging on reversal; weekly AB=CD pattern for the bearish to be continuing (adapted from the article)
- "The Euro may be carving out a top below the 1.11 figure against the US Dollar having rebounded as expectedafter last month’s ECB policy meeting. Prices appear to be carving out a bearish Head and Shoulders chart formation, although confirmation of the setup is still pending for now."
- "A daily close below the 1.0777-1.0818 area marked by the May 27 low and the 23.6% Fibonacci expansion clears the way for a challengeof the 38.2% level at 1.0602. Alternatively, a rebound that takes the pair above the December 15 high at 1.1060 opens the door for a test of falling trend line resistance at 1.1175."
- "The Head and Shoulders setup is not actionable for now absent a break of neckline support at 1.0777. More broadly, prices are too close to support to justify entering short from a risk/reward perspective. With that in mind, we will remain on the sidelines and wait for a better-defined opportunity to present itself."
- Free trading apps
- Over 8,000 signals for copying
- Economic news for exploring financial markets
You agree to website policy and terms of use
Daily price is on bearish market condition located near and below 100 period SMA (100 SMA) and 200 period SMA (200 SMA). The price is ranging within the following key reversal support/resistance levels:
Two bearish triangle patterns were created by the price to the crossed for the bearish trend to be continuing, and RSI indicator is estimating the ranging condition by direction.
Weekly price is on bearish market condition located to be below 100 period SMA (100 SMA) and 200 period SMA (200 SMA). The price is ranging within the following key support/resistance levels:
The key reversal resistance level for weekly price is Fibo resistance at 1.1713, and if the price breaks this level to above on close weekly bar so the reversal to the primary bullish condition will be started with the secondary ranging. One bearish triangle pattern was created by the price to the crossed for the bearish trend to be continuing, and RSI indicator is estimating the ranging bearish condition in the future.
Monthly price is on bearish condition for the ranging within the following key support/resistance levels:
The key reversal resistance level for monthly price is 50.0% Fibo resistance at 1.2224, and if the price breaks this level to above so the global reversal of EUR/USD price to the bullish condition will be started.