Forecast for Q2'16 - levels for EUR/USD - page 3
You are missing trading opportunities:
- Free trading apps
- Over 8,000 signals for copying
- Economic news for exploring financial markets
Registration
Log in
You agree to website policy and terms of use
If you do not have an account, please register
EURUSD Intra-Day Technical Analysis - ranging correction to the bearish reversal
H4 price is located to be inside Ichimoku cloud for the ranging correction condition inside the primary bullish trend: the price is testing 1.1345 support level together with descending triangle pattern for the ranging correction to be continuing up to 1.1326 support bearish reversal level. Chinkou Span line crossed the price to below for the bearish breakdown, and Absolute Strength indicator is estimating the intra-day bearish condition to be started in the near future.
If H4 price will break 1.1326 support level on close H4 bar so the bearish reversal will be started.
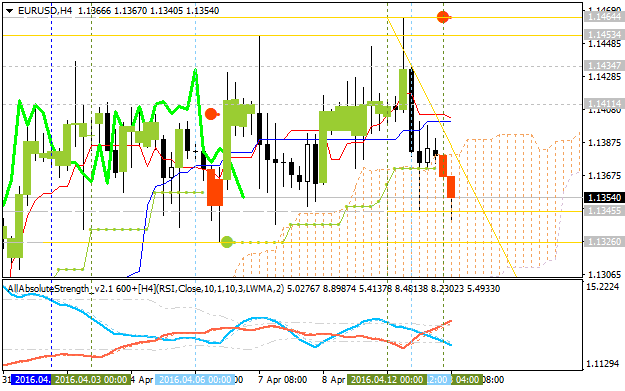
If H4 price will break 1.1454 resistance level so the primary bullish trend will be continuing.
If not so the price will be ranging within the levels.
SUMMARY : bearish reversal
TREND : breakdownForum on trading, automated trading systems and testing trading strategies
Press review
Sergey Golubev, 2016.04.13 14:52
EUR/USD Intra-Day Fundamentals: U.S. Retail Sales and 30 pips price movement
2016-04-13 12:30 GMT | [USD - Retail Sales]
if actual > forecast (or previous one) = good for currency (for USD in our case)
[USD - Retail Sales] = Change in the total value of sales at the retail level.
==========
EUR/USD M5: 30 pips price movement by U.S. Retail Sales news event :
Forum on trading, automated trading systems and testing trading strategies
Press review
Sergey Golubev, 2016.04.14 11:09
Trading News Events: U.S. Consumer Price Index (based on the article)What’s Expected:
Why Is This Event Important:
Even though the Federal Open Market Committee (FOMC) appears to be in no rush to implement higher borrowing-costs, stronger price growth may put increased pressure on the central bank to further normalize monetary policy especially as the U.S. economy approaches ‘full-employment.’
Nevertheless, waning confidence along with the slowdown in household spending may drag on price growth, and a softer-than-expected inflation report may weigh on the dollar as it increases the Fed’s scope to further delay its normalization cycle.
How To Trade This Event Risk
Bullish USD Trade: CPI Report Highlights Sticky U.S. Price Growth
- Need red, five-minute candle following the NFP print to consider a short trade on EUR/USD.
- If market reaction favors a bullish dollar trade, sell EUR/USD with two separate position.
- Set stop at the near-by swing high/reasonable distance from entry; look for at least 1:1 risk-to-reward.
- Move stop to entry on remaining position once initial target is hit; set reasonable limit.
Bearish USD Trade: Headline & Core Rate of Inflation Fail to Meet Market Forecast- Need green, five-minute candle to favor a long EUR/USD trade.
- Implement same setup as the bullish dollar trade, just in the opposite direction.
Potential Price Targets For The ReleaseEURUSD Daily
Forum on trading, automated trading systems and testing trading strategies
Press review
Sergey Golubev, 2016.04.14 16:02
EUR/USD Intra-Day Fundamentals: U.S. Consumer Price Index and 42 pips range price movement
2016-04-14 12:30 GMT | [USD - CPI]
if actual > forecast (or previous one) = good for currency (for GBP in our case)
[USD - CPI] = Change in the price of goods and services purchased by consumers.
==========
"The Consumer Price Index for All Urban Consumers (CPI-U) increased 0.1 percent in March on a seasonally adjusted basis, the U.S. Bureau of Labor Statistics reported today. Over the last 12 months, the all items index rose 0.9 percent before seasonal adjustment."
==========
EUR/USD M5: 42 pips range price movement by U.S. Consumer Price Index news event :
Forum on trading, automated trading systems and testing trading strategies
Press review
Sergey Golubev, 2016.04.15 16:27
EUR/USD Intra-Day Fundamentals: University of Michigan Index of Consumer Sentiment and 29 pips range price movement
2016-04-15 14:00 GMT | [USD - UoM Consumer Sentiment]
if actual > forecast (or previous one) = good for currency (for USD in our case)
[USD - UoM Consumer Sentiment] = Level of a composite index based on surveyed consumers.
==========
==========
EUR/USD M5: 29 pips range price movement by University of Michigan Index of Consumer Sentiment news event :
Forum on trading, automated trading systems and testing trading strategies
Press review
Sergey Golubev, 2016.04.16 09:23
EUR/USD Forecasts by Danske Bank (adapted from the source)
"EUR/USD has bought into fading ECB-Fed policy divergence after the ECB largely gave up the fight for euro depreciation and following recent dovish Fed comments. With positioning now much lighter in terms of short EUR/USD bets, we are probably entering a period in which relative rates could increasingly play a role again, and with a mere 50/50 pricing of a September Fed hike, and the ECB once again challenged on its mandate by market inflation expectations, we see relative rates moving for a weaker EUR/USD in 1-3M. Notably a negative Brexit risk premium could also be factored in ahead of the UK referendum but should be priced out swiftly in our main scenario of no Brexit."
"We keep our forecast profile unchanged, which leaves some downside near term (1-3M forecast at 1.12) followed by a sustained move higher towards 1.18 in 12M as valuation continues to drive the cross higher."
Forum on trading, automated trading systems and testing trading strategies
Press review
Sergey Golubev, 2016.04.16 09:40
Forex Weekly Outlook April 18-22 (based on the article)
German ZEW Economic Sentiment, US Building Permits, Glenn Stevens’s speech, UK employment data, US Crude Oil Inventories, Eurozone rate decision, US Philly Fed Manufacturing Index and Unemployment claims. These are the highlights of this week.
Forum on trading, automated trading systems and testing trading strategies
10 DAYS PIVOT POINT ANALYSIS ON EURUSD WITH VOLUMES
Tatu Francis, 2016.04.17 09:15
Hello Traders,
Attached my 10 day pivot point analysis, you can view my views on EURUSD. I trade a dual setup of cross loss (Hedge enabled) on support and resistance levels.
You can ask me for detail view of my analysis in here.
Forum on trading, automated trading systems and testing trading strategies
Press review
Sergey Golubev, 2016.04.18 14:58
EUR/USD Intra-Day Fundamentals: FOMC Member Dudley Speaks and 16 pips range price movement
2016-04-18 12:30 GMT | [USD - FOMC Member Dudley Speaks]
[USD - FOMC Member Dudley Speaks] = The speech opening remarks at the Federal Reserve Bank of New York's conference.
==========
EUR/USD M5: 16 pips range price movement by FOMC Member Dudley Speech news event :
Forum on trading, automated trading systems and testing trading strategies
Press review
Sergey Golubev, 2016.04.18 20:04
Technical evaluation of long-term BNZ forecasts (adapted from the article)
Bank of New Zealand made a long-term forecasts for some pairs as the following:
(June 2016)
(September 2016)
(December 2016)
(March 2016)
As we do not know the trading system they used for this forecast so let's evaluate on technical way by Metatrader together with using free Codebase indicators.
EUR/USD. As we see from the chart below - weekly price is on bearish market condition with the ranging within the following key support/resistance levels:
The price is on local uptrend as the bear market rally to be started in the end of February this year: price is testing Fibo resistance level at 1.1464 to above for the rally to be continuing. The next alternative scenario was evaluated by BNZ and it is related to the following: the price will be on bearish ranging within narrow support/resistance levels such as the following: 23.6% Fibo level at 1.1241 and 50.0% Fibo level at 1.0993. Bank of New Zealand is expecting for this ranging bearish condition to be continuing up to the end of Q1'17 for example.
I think the more likely sscenario for this pair in long-term situation is to ranging with more wide levels within 1.1400 and 1.1000, and those levels are fully related to the daily chart's s/r/ levels together RSI and price pattern's expectation for example.
NZD/USD. BNZ is estimating for this pair to be on bearish ranging within very narrow levels with the bearish trend to be continuing since 0.6500 to 0.6100. But if we look at weekly chart so we can see the bearish market condition with the different ranging levels: the price is on ranging within Fibo resistance level at 0.6965 and 61.8% Fibo support level at 0.6564. By the way, the ascending triangle p[attern was formed by the price to be crossed for the bear market rally to be continuing with the possible buloish reversal to be started in the future.
RSI indicator is also estinating the secondary rally with possible bullish reversal.
Thus, the most likely scenarios for the pair are the following: bearish ranging within 0.69/0.65 levels, or the bullish erversal to be started in case the price breaks 0.6965 to above.