Press review - page 470
You are missing trading opportunities:
- Free trading apps
- Over 8,000 signals for copying
- Economic news for exploring financial markets
Registration
Log in
You agree to website policy and terms of use
If you do not have an account, please register
2017 Energy Outlook: Must-Follow Sectors (based on the article)
OPEC:
"Market watchers will need to keep tabs on OPEC and non-OPEC monthly production decreases to see if key oil producers are adhering to their quotas under both the November OPEC production agreement and December OPEC/Non-OPEC production agreement."
West Texas Intermediate Crude Oil:
North American Oil Producers:
"2017 is not likely to see a roaring return to the exuberant shale oil production of 2012 and 2013. All eyes are currently on the hottest shale play right now, the Permian Basin in Texas. It is also important to keep tabs on the Bakken region in North Dakota."
Oil Services Firms:
"After two long years of contraction, companies that provide workers and equipment to oil and gas extraction companies will finally start expanding in 2017. This means oil services companies will gradually be restarting idled equipment and rehiring laid-off workers during 2017."
Forum on trading, automated trading systems and testing trading strategies
Press review
Sergey Golubev, 2014.03.07 09:08
Who Can Trade a Scalping Strategy? (based on dailyfx article)
The term scalping elicits different preconceived connotations to different traders. Despite what you may already think, scalping can be a viable short term trading methodology for anyone. So today we will look at what exactly is scalping, and who can be successful with a scalping based strategy.
What is a Scalper?
So you’re interested in scalping? A Forex scalper is considered anyone that takes one or more positions throughout a trading day. Normally these positions are based around short term market fluctuations as price gathers momentum during a particular trading session. Scalpers look to enter the market, and preferably exit positions prior to the market close.
Normally scalpers employ technical trading strategies utilizing short term support and resistance levels for entries. While normally fundamentals don’t factor into a scalpers trading plan, it is important to keep an eye on the economic calendar to see when news may increase the market’s volatility.
High Frequency Trading
There is a strong misconception that all scalpers are high frequency traders. So how many trades a day does it take to be considered a scalper? Even though high frequency traders ARE scalpers, in order for you to qualify as a scalper you only need to take 1 position a day! That is one of the benefits of scalping. You can trade as much or as little as you like within a giving trading period.
This also falls in line with one of the benefits of the Forex market. Due to the 24Hr trading structure of Forex, you can scalp the market at your convenience. Take advantage of the quiet Asia trading session, or the volatile New York – London overlap. Trade as much or as little as you like. As a scalper the choice is ultimately yours to make!
Risks
There are always risks associated with trading. Whether you are a short term, long term, or any kind of trader in between any time you open a position you should work on managing your risk. This is especially true for scalpers. If the market moves against you suddenly due to news or another factor, you need to have a plan of action for limiting your losses.
There are other misconceptions that scalpers are very aggressive traders prone to large losses. One way to help combat this is to make scalping a mechanical process. This means that all of your decisions regarding entries, exits, trade size, leverage and other factors should be written down and finalized before approaching the charts. Most scalpers look to risk 1% or even less of their account balance on any one position taken!
Who can Scalp?
So this brings us to the final question. Who can be a scalper? The answer is anyone with the dedication to develop a trading strategy and the time to implement that strategy on any given trading day.
=================
Trading examples
Metaquotes demo
GoMarkets broker, initial deposit is 1,000
Alpari UK broker initial deposit is 1,000
RoboForex broker initial deposit is 1,000
CAC 40 Stalls Under Previous High (based on the article)
USD/CNH Intra-Day Fundamentals: Caixin Services PMI and 171 pips range price movement
2017-01-05 01:45 GMT | [CNY - Caixin Services PMI]
if actual > forecast (or previous one) = good for currency (for CNY in our case)
[CNY - Caixin Services PMI] = Level of a diffusion index based on surveyed purchasing managers in the services industry.
==========
From official report:
"China ended 2016 on a positive note, with both manufacturers and service providers seeing stronger increases in business activity compared to November. While manufacturers saw the quickest rate of output expansion for nearly six years, services companies reported the strongest rise in activity for 17 months. The latter was shown by the seasonally adjusted Caixin General Services Business Activity Index rising from 53.1 to 53.4 in December."
==========
USD/CNH M5: 171 pips price movement by Caixin Services PMI news event
USD/CAD Technical Analysis: trading near Yearly Central Pivot at 1.3575 for direction (based on the article)
Intra-Day Fundamentals - EUR/USD, AUD/USD and DJIA: ISM Non-Manufacturing PMI
2017-01-05 15:00 GMT | [USD - ISM Non-Manufacturing PMI]
if actual > forecast (or previous one) = good for currency (for USD in our case)
[USD - ISM Non-Manufacturing PMI] = Level of a diffusion index based on surveyed purchasing managers, excluding the manufacturing industry.
==========
From official report:
"The report was issued today by Anthony Nieves, CPSM, C.P.M., CFPM, chair of the Institute for Supply Management® (ISM®) Non-Manufacturing Business Survey Committee. "The NMI® registered 57.2 percent in December, matching the November figure. This represents continued growth in the non-manufacturing sector at the same rate. The Non-Manufacturing Business Activity Index decreased to 61.4 percent, 0.3 percentage point lower than the November reading of 61.7 percent, reflecting growth for the 89th consecutive month, at a slightly slower rate in December."
==========
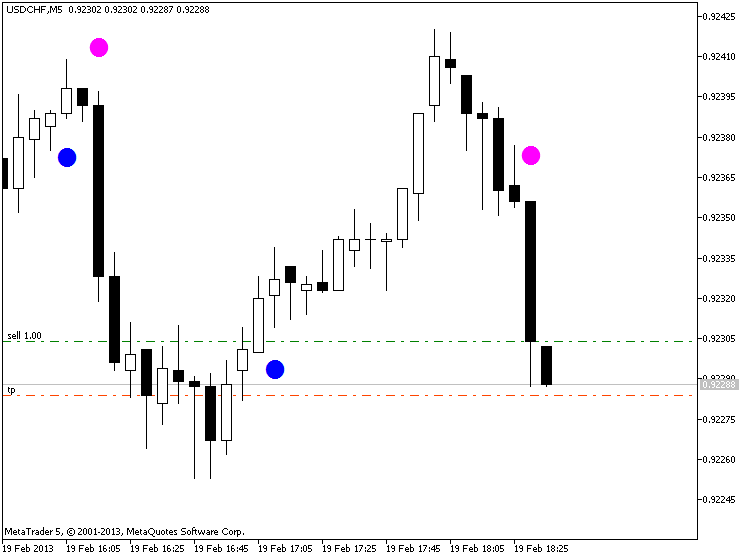
EUR/USD M5: 70 pips range price movement by ISM Non-Manufacturing news events
==========
AUD/USD M5: 37 pips range price movement by ISM Non-Manufacturing news events
==========
Dow Jones Industrial Average: pips range price movement by ISM Non-Manufacturing news eventsU.S. Commercial Crude Oil Inventories news event: intra-day ranging bearish, daily ranging bullish
2017-01-05 16:00 GMT | [USD - Crude Oil Inventories]
[USD - Crude Oil Inventories] = Change in the number of barrels of crude oil held in inventory by commercial firms during the past week.
==========
"U.S. commercial crude oil inventories (excluding those in the Strategic Petroleum Reserve) decreased by 7.1 million barrels from the previous week."
==========
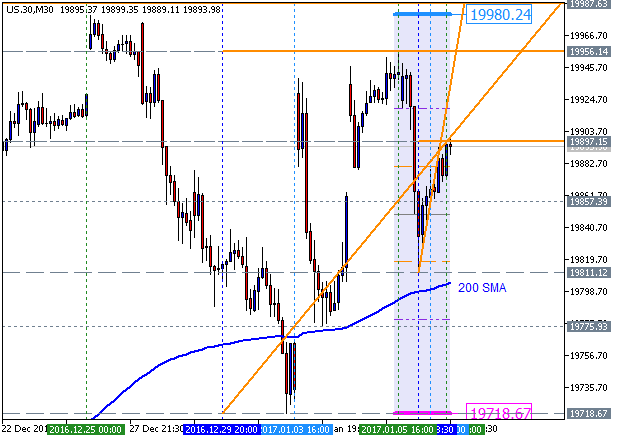
Crude Oil M5: ranging bearish. The price broke 200 period SMA for the breakout wqith the bearish reversal.If the price breaks 56.54 resistance level so the bullish reversal will be started.
If the price breaks 56.16 support so the bearish market condition will be resumed.
If not so the price will be on bearish ranging within the levels.
==========
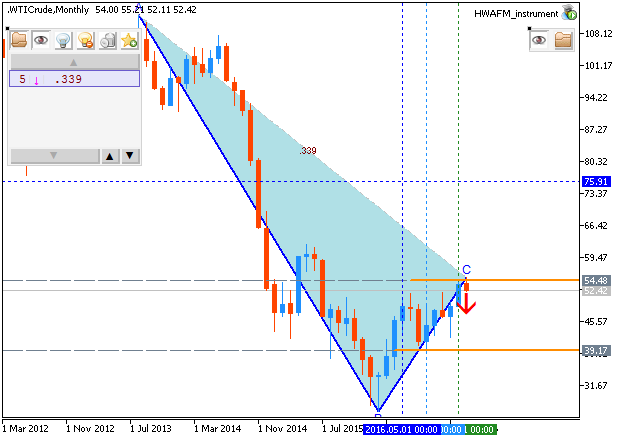
Crude Oil Daily: bullish ranging with 58.35 resistance level to be testing. The price is located above 100 SMA/200 SMA for the bullish are of the chart with 58.35 resistance level to be testing for the bullish trend to be continuing.If daily price breaks 58.35 resistance on close daily bar so the primary bullish trend will be continuing.
If the price breaks 54.03 support level to below on close daily bar so the local downtrend as a secondary correction within the primary bullish trend will be started.
If not so the price will be on bullish ranging within the levels.
Intra-Day Fundamentals - EUR/USD, GBP/USD and S&P 500: Non-Farm Employment Change
2017-01-06 13:30 GMT | [USD - Non-Farm Employment Change]
if actual > forecast (or previous one) = good for currency (for USD in our case)
[USD - Non-Farm Employment Change] = Change in the number of employed people during the previous month, excluding the farming industry.
==========
From the article: What To Expect From NFP? - Views From 10 Major Banks
BofA Merrill: "We look for a trend-like 175,000 gain in nonfarm payrolls. We expect 170,000 of this gain to come from the private sector and only 5,000 to come from the government sector. We think there is scope for the labor force participation rate to inch back up to 62.8% from 62.7%, and as a result, for the unemployment rate to move back up towards 4.8%. Smoothing through the volatility of wage growth in the past couple of months, we look for average hourly earnings to gain a trend-like 0.2% mom after a 0.1% mom contraction in November. This would push the year-over-year rate up to a healthier 2.7% from 2.5%."
==========
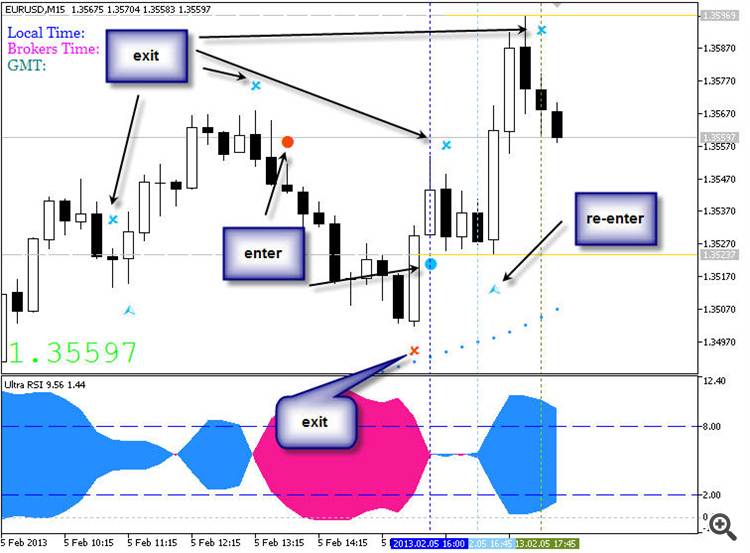
EUR/USD H4 ahead of NFP: bullish reversal with 1.0614 resistance to be broken for the bullish trend to be continuing
==========
GBP/USD H4 ahead of NFP: ranging within 200/100 SMA area waiting for direction
==========
S&P 500 H4 ahead of NFP: trending above 200 SMA and near above 100 SMA for the bullish trend to be continuing or for the ranging condition to be started
Nasdaq Hits New High as Dow, S&P 500 Slip (based on the article)
"The S&P 500 dipped 0.1% to 2,269.00 today, while the Dow Jones Industrial Average declined 42.87 points, or 0.2%, to 19,899.29. The Nasdaq Composite rose 0.2% to 5,487.94, a new record."
Dow Jones Industrial Average:
S&P 500:
"The S&P 500 reached new all-time highs in December and then moved horizontally on lighter volume as the holiday period approached. The S&P 500 reached overbought status on some oscillators in early December and both its internal momentum and the number of NYSE stocks making new 52-week highs pulled back markedly towards year-end. Equity put/call ratios (a contrary indicator) and bullish prognosticator show rising optimism and the percentage of NYSE stocks trading above their respective 50-day Moving Averages were at 67% at year-end (courtesy of Investors Intelligence). With the S&P 500 near its all-time highs, these negative divergences suggest a correction."
2017-01-06 13:30 GMT | [USD - Non-Farm Employment Change]
if actual > forecast (or previous one) = good for currency (for USD in our case)
[USD - Non-Farm Employment Change] = Change in the number of employed people during the previous month, excluding the farming industry.
==========
So, it means that if actual data > 175K forecasting data = good for USD. In case of EUR/USD - bearish (the price will go to the USD's side); in case of USD/JPY - bullish.
Those are the actual data forecasting by major banks:
Credit Agricole: 185K
EUR/USD - intra-day bearish
Goldman: 180k
EUR/USD - intra-day bearish
UBS: 170k
EUR/USD - intra-day bullish
Danske: 170,000
EUR/USD - intra-day bullish
BofA Merrill: 175,000
EUR/USD - intra-day ranging
Nomura: 175k
EUR/USD - intra-day ranging
Barclays: 175k
EUR/USD - intra-day ranging
SEB: 190k
EUR/USD - intra-day bearish
CIBC: 165K
EUR/USD - intra-day bullish
UOB: 250,000
EUR/USD - intra-day bearish