Join our fan page

Average Stocastic indicator for several timeframes - indicator for MetaTrader 4

If you are interested in auto trading on forex, then I can offer you ready-made products or write a work for you on your strategy.
my site https://cmillion.ru
- Views:
- 20242
- Rating:
- Published:
- Updated:
-
 You are missing trading opportunities:
- Free trading apps
- Over 8,000 signals for copying
- Economic news for exploring financial markets
Registration Log inYou agree to website policy and terms of use
If you do not have an account, please register -
 Need a robot or indicator based on this code? Order it on Freelance
Go to Freelance
Need a robot or indicator based on this code? Order it on Freelance
Go to Freelance
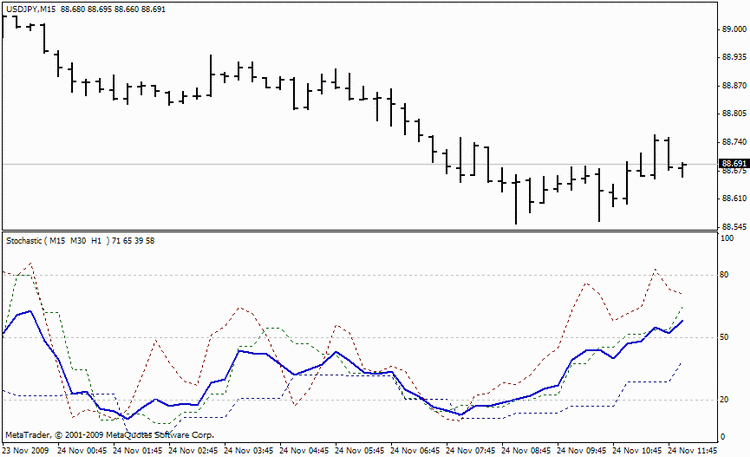
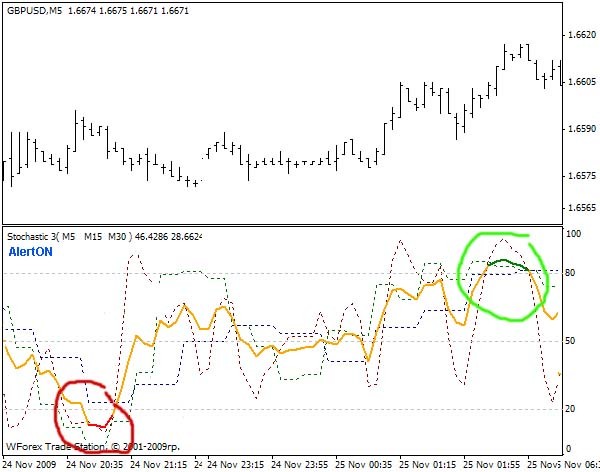
My first stategy was to buy when several stochastics are below 20, and sell when they are above 80.
It was unconvenient to change periods every time, so I have developed this indicator, maybe it can be useful.
It shows Stochastics for several timeframes in a single chart, also it calculates the average value (blue line on the chart).
Image:
My other solutions: https://www.mql5.com/ru/users/cmillion/publications Good Luck!
Editor's remark:
Note that it's a mirror translation of the original Russian version.
If you have any questions to the author, suggestions or comments, it's better to post them there.
If you have found this code useful for trading or educational purposes, don't forget to thank author.
-------------------------------------------------------------------------------------------------------------------------
Stochastic3_v2.mq4
Good Luck!
Translated from Russian by MetaQuotes Ltd.
Original code: https://www.mql5.com/ru/code/9352
Fine Fractal Channel
A finer resolution channel made of three bar fractals.
 Open and Close positions using the lines
It opens and closes positions using the crossing of the movable lines.
10 points on EURUSD & GBPUSD
The strategy is based on breakthrough of the maximum and minimum price values of the previous trading day.
Trade-Arbitrage
It works without losses. It uses the market inefficiency for the arbitrage.