Join our fan page

MacdPatternTraderv01. +300 points monthly - expert for MetaTrader 4

- Views:
- 21418
- Rating:
- Published:
- Updated:
-
 You are missing trading opportunities:
- Free trading apps
- Over 8,000 signals for copying
- Economic news for exploring financial markets
Registration Log inYou agree to website policy and terms of use
If you do not have an account, please register -
 Need a robot or indicator based on this code? Order it on Freelance
Go to Freelance
Need a robot or indicator based on this code? Order it on Freelance
Go to Freelance
You can find the original trading strategy here.
The EA was written in order to check the efficiency of trading strategy described in the link. The obtained results and the EA parameters can be found in the latest issue of our magazine.
Short Description of the EA Algorithm:
1. Timeframe: H4.
2. Symbol: EURUSD; Volume: 1 lot.
3. Indicators: EMA7, EMA21, EMA359, SMA89. MACD 5,13,1.
Buying Signal
1. MACD histogram must take a value below -0.0045.
2. After a maximum below -0.0045 has been formed, the histogram must grow above -0.0045 and form a minimum, after which you should buy.
3. A stop order is placed 10 points below the latest local minimum.
4. The first target for 30% of positions is closed, if the price value exceeds that of 21-period exponential average.
5. The second target for a half of all positions is closed as soon as the price reaches a value between the 89-period SMA and the 365-period EMA.
6. The third target for the resting positions is closed as soon as the price reaches the price support level.
Selling Signal
1. MACD histogram must take a value above 0.0045.
2. After a minimum above 0.0045 has been formed, the histogram must fall below 0.0045 and form a maximum, after which you should sell.
3. A stop order is placed 10 points above the latest local maximum.
4. The first target for 30% of positions is closed, if the price value is below 21-period exponential average.
5. The second target for a half of all positions is closed as soon as the
price reaches a value between the 89-period SMA and the 365-period EMA.
6. The third target for the resting positions is closed as soon as the price reaches the price resistance level.
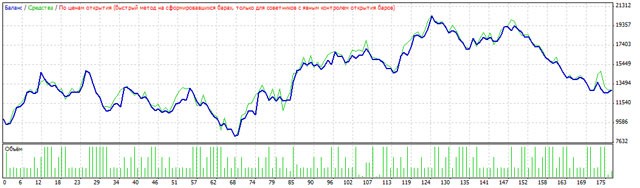
The EA tested with standard parameters:
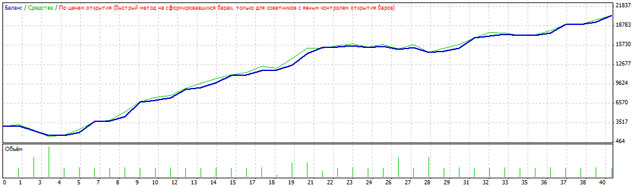
After parameters optimization:
You can find a full analysis with forward testing in our magazine.
P.S.: All possible variables of the strategy are represented as external variables. Experimenting with parameters, you can find good ones for intraday charts. It is not necessary to test on ticks. Please contact us, if you have any ideas or questions about the Expert Advisor.
Translated from Russian by MetaQuotes Ltd.
Original code: https://www.mql5.com/ru/code/8188
Kloss_
Previously uploaded Expert Advisor Kloss specially revised for optimization
 ZH_Functions_Tools_1
A set of function tools.
 Price and Volume Trend - PVT
Indicator Price and Volume Trend (PVT), like On Balance Volume (OBV), represents the cumulative sum of trade volumes calculated considering close price changes.
MVV_LinearRegression
The standard linear regression channel and support/resistance levels.